
How to Write Statistical Methods and Results in Academic Papers
For those unsure how to describe statistical analysis in the Methods and Results sections of undergraduate theses, master's theses, doctoral dissertations, or journal articles
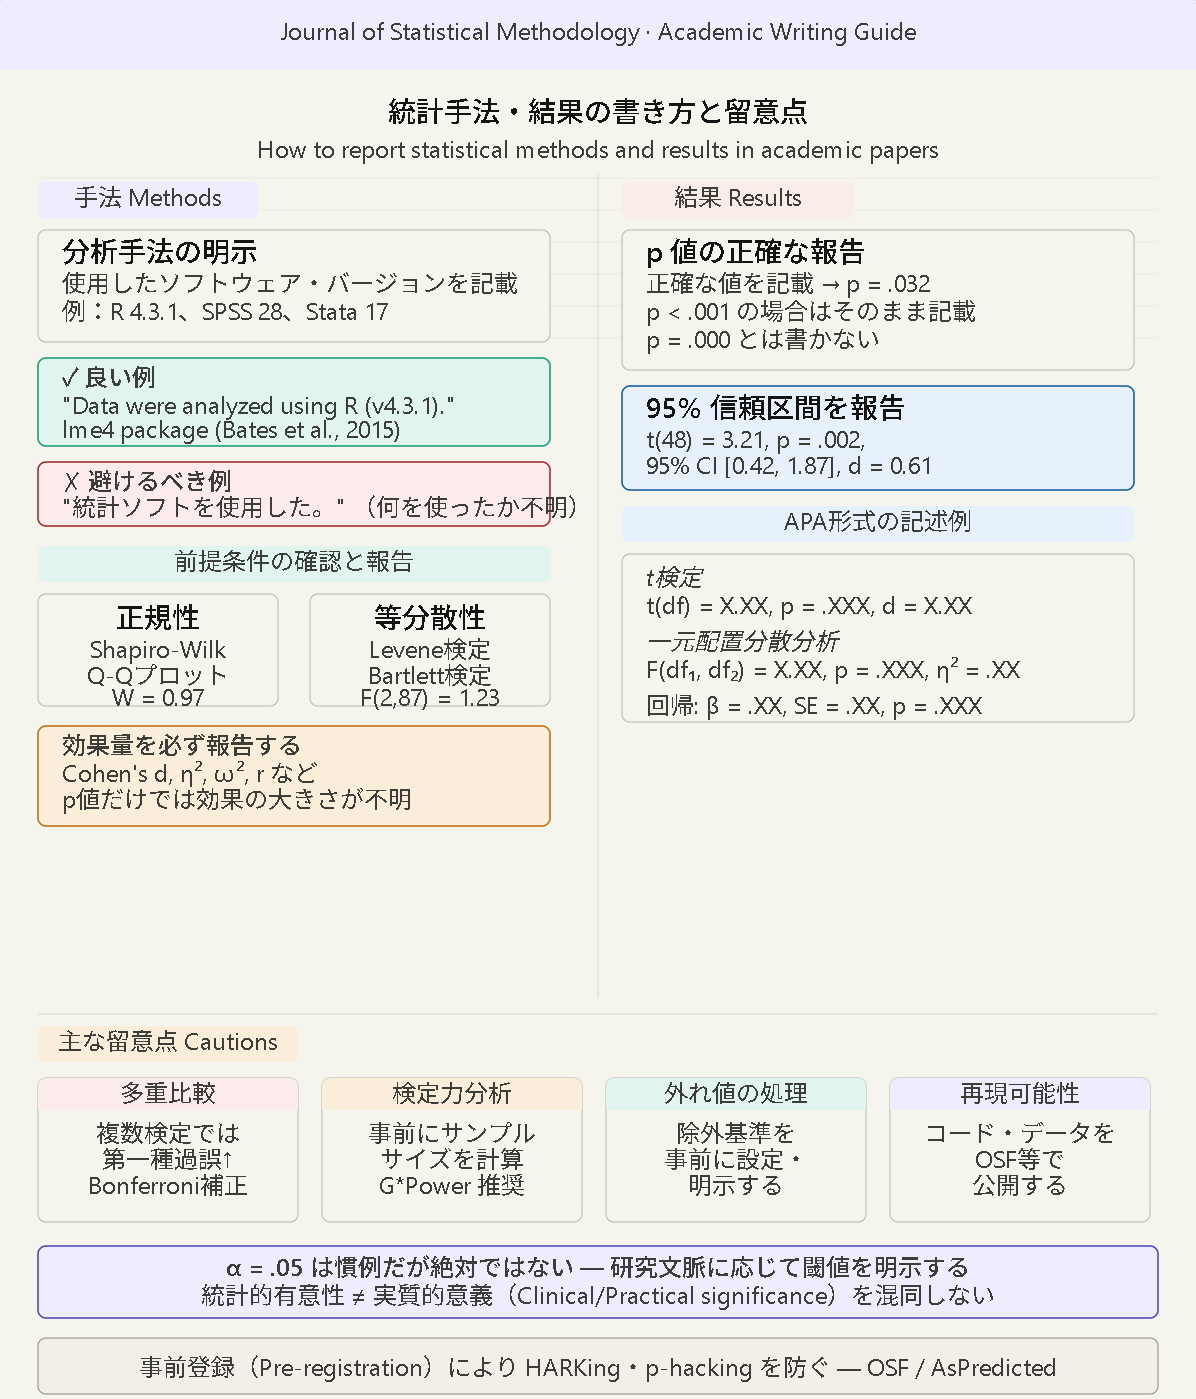
When a paper uses statistical analysis, the challenge is not only choosing the appropriate method. After selecting the method, researchers must decide what to write in Methods, how to present p-values and confidence intervals in Results, and how extensively tables and figures should be prepared .
Statistical output should not simply be pasted directly from software. Results produced by SPSS, R, EZR, Stata, JMP, and other tools should be organized in the context of the paper so that readers can understand the research objective, participants, variables, analytical methods, effect sizes, confidence intervals, p-values, model adjustment variables, and study limitations. Statistical reporting in a paper is therefore "not the task of listing numbers, but the task of explaining the evidence for the research question through text, tables, and figures" .
This article is intended for readers considering how to write statistical methods in papers、 how to write statistical results、 how to write statistical analysis in Methods、 statistics in paper Results sections、 how to report p-values、 how to report confidence intervals、 statistical analysis for journal submissions For readers searching for topics such as these, this article explains how to write statistical methods and results and what to watch for. It covers Methods, Results, Discussion, tables and figures, and peer-review responses in a way applicable to medical papers, nursing research, psychology, education, social sciences, business administration, questionnaire surveys, clinical research, and mixed-methods research.
The first point to understand is that In a paper, it is more important to clearly explain why a statistical method was chosen and what can validly be concluded from the results than merely to state which software was used . Emphasizing only p-values is not enough. Reporting effect sizes, 95% confidence intervals, adjustment variables, sample size, missing-data handling, and the number of analyzed participants makes the statistical evidence more persuasive.
- • What to Check First When Reporting Statistics in a Paper
- • How to Write Statistical Methods in the Methods Section
- • How to Write Statistical Results in the Results Section
- • Writing Examples by Statistical Method
- • Reporting Examples for t-Tests, ANOVA, and Chi-Square Tests
- • Reporting Examples for Correlation and Regression Analysis
- • Reporting Examples for Logistic Regression and Cox Regression
- • Points to Watch When Presenting Statistical Results in Tables and Figures
- • Cautions When Reporting p-Values, 95% Confidence Intervals, and Effect Sizes
- • How to Report Statistical Software, Version, and Significance Level
- • Statistical Reporting Problems Commonly Raised in Peer Review
- • Statistical Reporting Support Available from Stat Agent
- • Frequently Asked Questions
- • Summary
What to Check First When Reporting Statistics in a Paper
Before writing statistical methods and results, first confirm the relationship among the research objective, primary outcome, analysis sample, variable types, and analytical methods. Statistical reporting is not simply a matter of polishing the Methods and Results sections. The research question stated in the Introduction, the analysis described in Methods, the findings presented in Results, and the interpretation in Discussion should be internally consistent.
For example, a study asking whether scores improved before and after an intervention may use a paired t-test or Wilcoxon signed-rank test. A study examining factors associated with disease presence may use logistic regression. A study analyzing time to death or recurrence may use Kaplan–Meier curves, the log-rank test, and a Cox proportional hazards model. In this way, checking whether the research question and statistical method correspond is the starting point for statistical reporting.
Align the Research Objective with the Primary Outcome
The primary outcome is the result measure that the study most aims to clarify. How statistics are described depends on whether the primary outcome is continuous, categorical, ordinal, or time-to-event. HbA1c, blood pressure, scale scores, and test scores are often treated as continuous variables, whereas the presence or absence of complications, recurrence, or pass/fail outcomes are typically binary.
The Methods section should distinguish primary and secondary outcomes and state the statistical methods used for each. In Results, presenting the primary outcome first and clearly labeling secondary or exploratory analyses makes the structure of the paper easier to understand.
Clearly State the Analysis Sample and Exclusion Criteria
Reporting the analysis sample size is extremely important. A study may enroll 100 participants, but missing data or exclusion criteria may reduce the actual analysis sample to 85. Unless the text and tables clearly state how many participants were analyzed, readers may have difficulty assessing the reliability of the results.
The analysis sample, reasons for exclusion, handling of missing data, use of complete-case analysis, and use of multiple imputation all affect both Methods and Results. Medical and clinical papers may use a flow diagram to show participant disposition. Questionnaire studies should likewise report the number distributed, number returned, number of valid responses, and final analysis sample.
How to Write Statistical Methods in the Methods Section
The statistical analysis subsection of Methods should describe the statistical procedures, how data were summarized, the significance level, software used, handling of missing values, variables adjusted for in multivariable analysis, and related details. The goal is not merely to list procedures but to make clear which method was applied to which data.
| Item to Report | Examples of What to Report in Methods |
|---|---|
| Descriptive Statistics | Continuous variables were presented as mean ± standard deviation or median [interquartile range], and categorical variables as counts and percentages. |
| Group Comparisons | Continuous variables were compared using a t-test or Mann–Whitney U test, and categorical variables using a chi-square test or Fisher's exact test. |
| Multivariable Analysis | Logistic regression or linear regression was performed to examine factors associated with the primary outcome. |
| Adjustment Variables | Variables considered clinically or theoretically important, such as age, sex, disease severity, and medical history, were included as adjustment variables. |
| Significance Level and Software | A two-sided p-value <0.05 was considered statistically significant, and analyses were performed using SPSS version XX or R version X.X.X. |
Methods does not need to reveal the results in advance. It should, however, explain the criteria used to select statistical procedures and the analysis workflow in enough detail for a third party to understand. Particularly in journal articles, transparency of analytical methods directly affects the credibility of the results , so vague descriptions should be avoided.
How to Write Statistical Results in the Results Section
Results should present statistical findings objectively. Unlike the Discussion, the section should not broaden interpretation beyond the data; it should report the findings completely and concisely. Statements such as "a significant difference was observed" or "no significant difference was observed" are not enough. Means, proportions, differences, odds ratios, regression coefficients, hazard ratios, 95% confidence intervals, p-values, and related statistics should be combined appropriately.
Report Effect Sizes and Confidence Intervals, Not Only p-Values
A p-value is an indicator of statistical significance, but it does not directly show the magnitude of an effect. Results should therefore report measures such as mean differences, standardized mean differences, correlation coefficients, regression coefficients, odds ratios, hazard ratios, and 95% confidence intervals in addition to p-values.
For example, if logistic regression yields an odds ratio of 2.10, a 95% confidence interval of 1.20 to 3.68, and p=0.009, the positive association between the factor and outcome is easier to understand. Reporting only the p-value does not convey the strength of the association or uncertainty of the estimate.
Report Nonsignificant Results Carefully
Nonsignificant findings are also important. Rather than writing only "no significant difference was observed," reporting the actual values, confidence intervals, sample size, and direction of the estimate helps readers judge what the result means.
For example, even with p=0.08, a large effect size and wide confidence interval may suggest insufficient sample size or low statistical power. Conversely, a small effect size with a confidence interval excluding clinically important differences may suggest that the true difference is small. Results should therefore be reported in terms of both effect magnitude and uncertainty, not only statistical significance .
Writing Examples by Statistical Method
The information that should be reported differs by statistical method. For a t-test, group means and standard deviations, the mean difference, and p-value are central. For a chi-square test, counts, percentages, and the p-value are important. For regression analysis, regression coefficients, standard errors, 95% confidence intervals, p-values, and adjustment variables are key.
| Statistical Method | Key Information to Present in Results |
|---|---|
| t-Test | Mean ± standard deviation for each group, mean difference, 95% confidence interval, and p-value |
| Mann–Whitney U Test | Median [interquartile range] for each group and p-value |
| Chi-Square Test | Counts, percentages, and p-value |
| Correlation Analysis | Correlation coefficient, 95% confidence interval, p-value, and scatterplot |
| Linear Regression Analysis | Regression coefficient, standard error, 95% confidence interval, p-value, coefficient of determination, and adjustment variables |
| Logistic Regression Analysis | Odds ratio, 95% confidence interval, p-value, adjustment variables, and number of events |
| Cox Regression Analysis | Hazard ratio, 95% confidence interval, p-value, follow-up duration, censoring, and adjustment variables |
The key is to select the information shown in text and tables according to the research objective. Not every item in software output needs to be reported, but information necessary for readers to judge the results should not be omitted.
Reporting Examples for t-Tests, ANOVA, and Chi-Square Tests
t-Tests, ANOVA, and chi-square tests are fundamental statistical methods frequently used in papers. Even for basic methods, incomplete reporting can make the meaning of the findings unclear.
For a t-test, do not simply write "there was a significant difference." Report the mean and standard deviation for each group, the mean difference, and the p-value. For example: "The mean score was 82.4 ± 10.2 in the intervention group and 75.1 ± 11.8 in the control group, with a significantly higher score in the intervention group (p=0.018)." This allows readers to understand both the direction and magnitude of the difference.
For ANOVA, because three or more group means are compared, report not only whether an overall group difference was found but also, when appropriate, the results of multiple-comparison procedures. For example: "One-way ANOVA showed a significant difference among groups (p=0.004). Post hoc comparisons showed that Group A was significantly higher than Group C." The overall test and post hoc comparisons should be reported separately.
For a chi-square test, report counts and percentages together with the p-value. For example: "The complication rate was 12.0% in Group A and 25.0% in Group B and was significantly higher in Group B (p=0.032)." If the sample size is small, also state that Fisher's exact test was used when applicable.
Reporting Examples for Correlation and Regression Analysis
In correlation analysis, it is important to report both the magnitude and direction of the correlation coefficient. Writing only that "there was a correlation" is insufficient; indicate whether the correlation was positive or negative and how strong it was. For example: "Age and reaction time showed a significant positive correlation (r=0.42, p=0.003)."
Regression analysis describes the relationship between a dependent variable and explanatory variables. In linear regression, reporting the regression coefficient, 95% confidence interval, and p-value shows how strongly an explanatory variable is associated with the outcome. In multivariable regression, the variables used for adjustment are also important.
For example: "In linear regression adjusted for age, sex, and baseline value, the intervention group had scores 5.8 points higher than the control group (β=5.8, 95% CI: 1.9–9.7, p=0.004)." This single sentence communicates the comparison group, adjustment variables, effect size, uncertainty, and statistical significance.
Reporting Examples for Logistic Regression and Cox Regression
Logistic regression is used when the outcome is binary. Results are commonly reported as odds ratios together with 95% confidence intervals and p-values. For example: "In logistic regression adjusted for age, sex, and disease severity, the intervention group had lower odds of complications (adjusted OR=0.48, 95% CI: 0.25–0.91, p=0.025)."
The important point is not merely to report the odds ratio, but also to state what variables were adjusted for. When both crude and adjusted odds ratios are reported, presenting them in a table improves readability. Because models can become unstable when too many explanatory variables are included relative to the number of events, the rationale for variable selection should also be described in Methods.
Cox regression is used for time-to-event outcomes such as death, recurrence, discharge, or treatment discontinuation. Results are expressed as hazard ratios. For example: "In the Cox proportional hazards model, the treatment group had a significantly lower risk of recurrence (adjusted HR=0.62, 95% CI: 0.41–0.94, p=0.024)." Report the hazard ratio, confidence interval, p-value, and adjustment variables.
Points to Watch When Presenting Statistical Results in Tables and Figures
Papers often organize statistical findings into tables and figures rather than explaining everything in the text. Tables are well suited to presenting exact values, whereas figures are useful for visually communicating trends and differences. The choice depends on how the research findings should be understood by the reader.
Participant or patient characteristics are often presented as Table 1, including age, sex, major background factors, and p-values for group comparisons. Regression results are easier to read when presented in a table containing odds ratios or regression coefficients, 95% confidence intervals, and p-values. In survival analysis, Kaplan–Meier curves are commonly shown as figures, with log-rank and Cox regression results supplemented in the text or tables.
When preparing tables and figures, clearly specify units, rounding rules, decimal places, abbreviation definitions, missing values, and the number of observations analyzed . For journal submissions in particular, table formatting should follow the target journal's instructions.
Cautions When Reporting p-Values, 95% Confidence Intervals, and Effect Sizes
When reporting p-values, it is generally preferable to provide exact values rather than only writing "p<0.05," where possible. For very small p-values, notation such as "p<0.001" may be appropriate. Follow the journal or conference guidelines when specific rules are provided.
A 95% confidence interval is important information about uncertainty in an estimate. For odds ratios and hazard ratios, whether the interval includes 1 is related to statistical significance. For mean differences and regression coefficients, whether the interval includes 0 is important.
Effect size expresses the magnitude of a difference or association. A statistically significant result may have little practical importance if the effect size is extremely small. Conversely, even without statistical significance, the effect size and confidence interval may indicate value for further research. Papers should distinguish statistical significance from practical or clinical significance .
How to Report Statistical Software, Version, and Significance Level
The statistical analysis section should report the name and version of the software used. For example: "All statistical analyses were performed using IBM SPSS Statistics version XX" or "Statistical analyses were conducted using R version X.X.X." In a Japanese-language paper, the equivalent would be a statement such as "SPSS Statistics version XX was used for statistical analysis."
The significance level is commonly described as "a two-sided p-value <0.05 was considered statistically significant." If multiple-comparison adjustments, one-sided tests, Bayesian methods, or other special criteria are used, those standards should be stated explicitly.
If EZR, Stata, JMP, GraphPad Prism, jamovi, JASP, or other software is used, record the software name and version as well. Researchers sometimes forget the version when writing the paper later, so recording it at the time of analysis is advisable.
Statistical Reporting Problems Commonly Raised in Peer Review
Incomplete statistical reporting can lead reviewers to request revisions. Common issues include unclear test names, failure to describe assessment of normality, unspecified handling of missing values, unexplained adjustment variables in multivariable analysis, weak justification of sample size, and omission of effect sizes or confidence intervals.
- Methods lists statistical tests but does not clarify which variables each test was applied to
- Results reports only p-values without effect sizes or 95% confidence intervals
- The number of participants analyzed is inconsistent across tables, text, and flow diagrams
- Missing-data handling, outlier handling, or exclusion criteria are not described
- The rationale for selecting adjustment variables in multivariable analysis is not explained
- The role of multiple comparisons or exploratory analyses is unclear
- The software name, version, or significance level is not reported
When responding to peer review, it is necessary to check consistency across Methods, Results, Tables, Figures, and the response letter rather than revising only the cited passage. Changing one section in isolation can create numerical inconsistencies elsewhere.
Statistical Reporting Support Available from Stat Agent
Stat Agent supports research data from universities, graduate schools, medical institutions, research organizations, businesses, and local governments through statistical analysis, organization of analysis plans, analysis using SPSS, R, EZR, Stata, and related software, preparation of tables and figures, assistance with Methods and Results, and refinement of statistical reporting for journal submissions and peer-review responses.
When converting statistical software output into material suitable for a paper, we especially emphasize checking not only p-values but also effect sizes, 95% confidence intervals, adjustment variables, analysis sample size, missing-data handling, and consistency with the research design and preparing the findings in a form that readers can understand.
We can provide specific support based on your research if you are unsure how to write SPSS output in a paper, want to convert R results into Methods and Results text, have been asked by reviewers to add statistical information, or need to reconcile numbers between tables and the main text.
Frequently Asked Questions
Q1. Is it enough to report only p-values in a paper?
Often, no. A p-value indicates statistical significance but does not show effect magnitude or uncertainty. Reporting mean differences, odds ratios, regression coefficients, hazard ratios, 95% confidence intervals, effect sizes, and related measures makes the results easier to interpret.
Q2. How much detail should the Methods section include about statistical procedures?
It should contain enough information for readers and reviewers to understand which statistical methods were used for which data. Tests used, data presentation, significance level, software, handling of missing data, and adjustment variables in multivariable analyses should be stated as needed.
Q3. Can nonsignificant results be omitted?
If the result relates to the primary outcome or research objective, it should generally be reported even when it is not statistically significant. Presenting nonsignificant results together with effect sizes and confidence intervals contributes to interpretation. Omitting inconvenient findings may undermine research transparency.
Q4. Can I paste statistical software output tables directly into a paper?
Usually, software output should be reformatted to match the paper. Output tables often contain unnecessary information and may be difficult for readers to interpret. Select the numbers required for the research objective and prepare headings, units, footnotes, and abbreviation definitions appropriately.
Q5. How should I respond when reviewers criticize statistical reporting?
First determine whether the issue is an insufficient Methods description, missing numerical information in Results, or a problem with the analytical method itself. Additional analysis, table revision, text additions, or expanded limitations may be necessary. After revision, check that numbers are consistent across the text, tables, figures, and response letter.
Summary | Statistical Reporting Is Evidence Explaining the Results, Not Merely the Names of Methods
When reporting statistical methods and results, listing test names and p-values is not enough. A convincing paper consistently reports the research objective, primary outcome, analysis sample size, data type, statistical methods, effect sizes, 95% confidence intervals, adjustment variables, missing-data handling, software, and significance level.
Particularly in journal submissions and peer-review responses, reviewers ask not only "what analysis was performed" but also "why the analysis was appropriate and what can validly be concluded from the results" . Statistical results support the claims of the research while also providing a basis for transparently describing its limitations.
Stat Agent supports not only statistical analysis itself, but also writing of statistical methods in papers, organization of Results, preparation of tables and figures, responses to reviewer comments, and consistency checks across Methods, Results, and Discussion. I do not know how to write statistical results in my paper、 Reviewers have asked me to revise the statistical reporting、 I want to prepare persuasive tables and figures for a journal submission Please feel free to contact us in these situations.
