
Positioning Map and Factor Analysis Case StudyFactor analysis case
Here we present a case study ofPositioning Map and Factor Analysis Case Studyour support involvingsupport case involving factor analysis and positioning-map creation used in university research, undergraduate research, master's theses, and market research
Stat Agent does more than simply use statistical software to produce numerical output. We provide integrated support includingclarification of analytical objectives, data review, missing-value handling, factor analysis, principal component analysis, positioning-map creation, result interpretation, and report preparation.
Please note thatto protect privacy, portions of the title and text have been adjusted, and published images have also been processed.Thank you for your understanding.
Case Study: Factor Analysis and Positioning Map on Young People's Declining Interest in Car Ownership
Step 1 | Clarifying the Analytical Objective and Conducting the Initial Consultation
First, we carefully confirm the data available, the research objective, and what the client wants the analysis to reveal.
Even with the same theme—“young people's declining interest in cars”—the analysis can focus on different perspectives, such aseconomic factors,、changes in lifestyle,、changes in values, or、differences in transportation environments between urban and rural areas.The appropriate statistical methods and report structure vary substantially depending on the analytical perspective.
Therefore, before beginning analysis, Stat Agent clarifieswhat the client wants to determine, which variables should be central, and whether factor analysis, principal component analysis, or a positioning map is most appropriate.
In this case, because the issue needed to be examined mainly from an economic perspective, we designed the analysis so that the findings and discussion would remain consistent not only with the questionnaire data but also with relevant background information and the direction of previous research.
When AI is used, we do not simply generate results mechanically. Human reviewers also checkthe analytical objective, measurement level, sample size, missing values, relationships among variables, and interpretability,helping produce more practical and persuasive analytical findings.
 Step 2 | Reviewing the Data and Designing the Analysis
After the initial consultation, we review the actual data and confirm whether it is in a condition suitable for analysis.
At this stage, we confirmpresence of missing values,、number of valid responses,、coherence among scale items, and、whether the variables are suitable for factor analysis
are among the points reviewed. Factor analysis extracts common latent factors underlying multiple questionnaire items, but it cannot be applied mechanically to every dataset. Interpretation may become unstable when the sample is small, relationships among items are weak, or the scale has structural problems.
Therefore, before entering data into statistical software, Stat Agent checks consistency between the data condition and the research objective and, where needed, recommendsappropriate use of factor analysis, principal component analysis, cross-tabulation, correlation analysis, regression analysis, and related methods.
In this case, the work followed the steps below.
1. Data review: check missing values and valid response counts; organize variable names and item content
2. Factor analysis: extract common factors underlying questionnaire items
3. Positioning map: visually arrange results in an easy-to-understand form
4. Analysis report: summarize results and discussion in approximately 2,000 Japanese characters
5. Results and conclusion: concisely summarize the main implications
CarefulIntegrating data processing, statistical analysis, visualization, and report preparationproduces analytical deliverables that are more useful for research and practice than a simple list of numbers.
Step 3 | Conducting Factor Analysis and Creating the Positioning Map
After data review is complete, we conduct factor analysis and examine the meaning of the extracted factors.
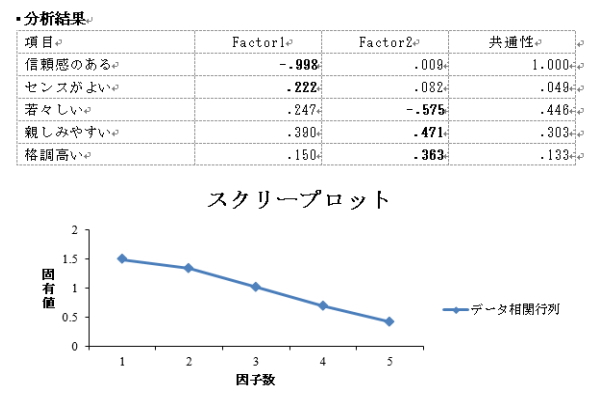
In factor analysis, we assess how multiple questionnaire items group together and, as needed, review factor loadings, communalities, cumulative variance explained, and the rotated factor structure.
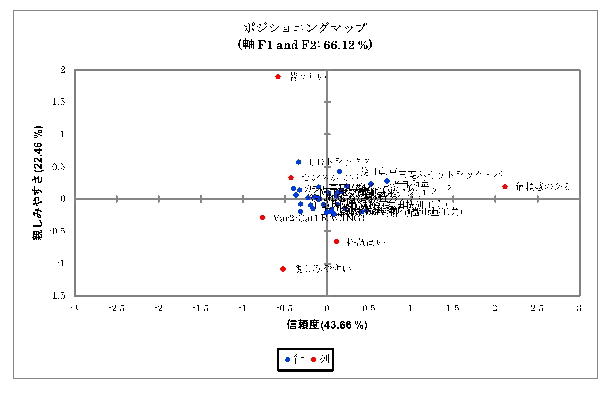
Based on those results, we create a positioning map to present the findings clearly and visualize how individual items or objects are positioned relative to one another.

In university research and market research, statistical results may be difficult to communicate if shown only in tables. A positioning map can make it easier to understandrelative distances among objects, differences in evaluation dimensions, clusters in perception, and distinctive distribution patternsintuitively.
Stat Agent accepts a wide range of consultations regardingTo balance statistical validity with ease of explanation,we do more than draw a chart: we also organize what can be inferred from the figure and how it should be reflected in the report.
When AI is used to assist with organizing discussion points, the final analytical results, statistical interpretation, and meaning of figures and tables are still reviewed by people,including alignment with the research objective and wording that readers can understand,and are adjusted carefully.
Step 4 | Reviewing Literature and Discussing the Analytical Results
After the factor analysis and positioning map have been finalized, we organize literature that helps explain the meaning of the results.
Statistical analysis is not complete merely by presenting numbers and figures; it is important to explain how the findings relate to previous research and the broader social context.
In this case, concerning young people's declining interest in cars, we organized interpretations of the findings in light of economic burden, employment conditions, urban transportation environments, lifestyle changes, and the shift in values from ownership toward use.
Stat Agent accepts a wide range of consultations regardingWhile human reviewers check the connection between the literature and analytical results, AI may be used as a supplementary tool to identify omitted discussion points, insufficient explanation, or possible imbalance in the discussion,helping createhelping refine the work into alogical and persuasive report.
Step 5 | Preparing the Report and Finalizing the Deliverables
Finally, we prepare a report summarizing the analytical results, figures and tables, discussion, and conclusion.
At this stage, we do more than simply check for typographical errors. We confirmWe check whether、the analytical results correspond to the written explanation,、the figures and tables are presented clearly,、statistical terminology is used appropriately, andthe conclusion addresses the research objective.
Depending on your needs, the delivery format can be adjusted flexibly, including a Word report, Excel summary tables, figures for PowerPoint, or notation that can be inserted directly into a manuscript.
We also support English-language papers, international conference materials, and organization of figures and tables for peer-review responses, with deliverables tailored to the research objective and submission destination.
Through this workflow, Stat Agent provides integrated support forAnalysis outsourcing, statistical analysis outsourcing, factor analysis, positioning-map creation, and report preparation
Before production begins, we carefully confirm the required level of detail, analytical methods, report length, figure/table format, and delivery format. If questionnaire surveys, field surveys, or tabulation are involved, we can also organize questionnaires and summary tables.
Expedited delivery:Delivery within 12 hours may also be available
Contact Us
Over 30,000 consultations / Over 19,000 completed engagements. To date, we have supported consultations and requests involving analysis outsourcing, statistical processing, questionnaire surveys, marketing support, and more. Our experienced consultants carefully listen to your needs so that we can provide the right support. We offer prompt and accurate work at reasonable, accessible rates and are committed to delivering dependable results. Stat Agent team members across Japan will take responsibility for supporting you.
*We provide the profile of the person responsible for your project when you apply.
For outsourced analysis and statistical processing, choose Stat Agent.
*When order volume is high, it may be difficult to reach us by phone.
We apologize for the inconvenience. We respond in order of receipt, so if your matter is urgent, please contact us by
