
Aggregation and Visualization / Data ProcessingTabulation and graphing / Data processing
Stat Agent accepts a wide range of consultations regardingAggregation, Visualization, and Data ProcessingWe accept a wide range of requests involving questionnaire surveys, research data, operational data, paper-based response forms, Excel data, and existing summary tables. We provide integrated support for simple aggregation, cross-tabulation, descriptive statistics, creation of various graphs, data organization, and table preparation.
Aggregation and visualization involve more than simply listing numbers or creating graphs. It is important todesign aggregation dimensions suited to the objective,、select graph formats that communicate effectively to the audience,、and format outputs so they can be used in documents and academic papers.Accordingly, we emphasize processing design suited to the purpose, including Excel aggregation, questionnaire aggregation, digitization of paper-based data, cross-tabulation, histograms, bar charts, pie charts, scatterplots, and radar charts.
In recent years, more people have used generative AI and automated graphing tools to create initial summary tables and graphs. However, AI-generated output may containincorrect aggregation conditions, overlooked handling of missing values, inappropriate graph types, inconsistent axes, legends, or units, and presentations that are difficult for readers to understand.For research reports, academic papers, internal documents, and marketing materials in particular, it is necessary to verify not only appearance but also the basis of aggregation and accuracy of presentation.
For this reason, Stat Agent emphasizesWe emphasize human review of the data structure, aggregation objective, and delivery format and refine the results into accurate, readable summary tables and graphs.We can also polish summary tables and graphs already created with AI or Excel, revise existing graphs, and adjust notation for papers and reports.
For clients who have data but are unsure how to aggregate it, have created graphs that are difficult to read, want to digitize paper response forms into Excel and aggregate them, or want professional review of tables and graphs created with AI, we provide support tailored to the objective.
Types of Aggregation, Visualization, and Data Processing
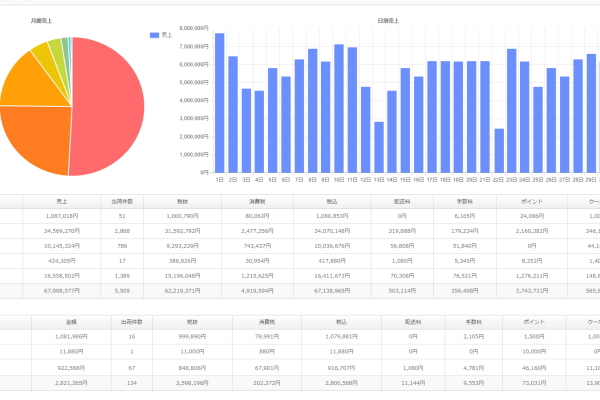
[Main Consultation Categories]
| Task Category | Main content | Where human expertise is difficult to replace with AI | Polishing of AI-Generated Aggregation and Existing Output |
|---|---|---|---|
| Simple Aggregation and Table Creation |
• Frequency counts for each item • Organization of percentages, means, and standard deviations • Verification of response counts • Creation of Excel tables • Organization of tables for research and reporting materials |
Key decisions include how missing or invalid responses should be handled and how aggregation units should be defined,which requires judgment about aggregation conditions.including how theoretical hypotheses connect to measurement and structural models. | For summary tables created with AI or Excel, we check numerical consistency, headings, units, notes, and inconsistent notation and refine them into readable tables. |
| Cross-Tabulation and Descriptive Statistics |
• Cross-tabulation by participant attributes • Organization of frequencies and percentages • Means, medians, and standard deviations • Recoding and grouping • Adjustment of frequency categories in cross-tabulation |
The work requires decisions about which variables should define the axes and how categories should be grouped,based on the analytical objective.. | For cross-tabulations created with AI, we review row/column orientation, the denominator used for percentages, and the appropriateness of category consolidation. |
| and graph creation |
• Pie charts and bar charts • Histograms and stacked bar charts • Radar charts • Scatterplots and line graphs • Stacked bar charts |
According to the characteristics of the data, we determinewhich graph format communicates the findings most effectively. | For AI-generated or existing graphs, we adjust axes, legends, labels, color treatment, size, and layout for use in documents. |
| Digitization of Paper-Based Data |
• Conversion of paper response forms into Excel • Entry of handwritten data • Double-checking after data entry • Verification of record counts • Aggregation and graph creation after digitization |
Because paper materials are prone to reading and input inconsistencies,human review and consistency checks. | are important. For data read by OCR or AI, we check misread characters, omissions, inconsistent notation, and digit shifts and organize the data into a form suitable for aggregation. |
| Data Processing and Preprocessing |
• Checking and removing missing values • Standardizing significant digits • Splitting and merging sheets • Organizing variable and item names • Extracting records based on specific conditions |
Decisions about what should be retained or excluded requirejudgment based on the analytical objective and intended use of the deliverable.This requires more than automated method selection. | For data processed by AI or automated tools, we review missing-value handling, category consolidation, number of digits, and consistency of notation. |
| Revision of Existing Graphs and Tables |
• Revision of existing graphs • Readable restructuring of existing tables • Formatting for papers and reports • Standardization of fonts, colors, and sizes • Organization of notes, legends, and units |
According to the intended reader or submission destination, this requireseditorial judgment that balances clarity with accuracy.This requires more than automated method selection. | We refine existing tables and graphs for use in research reports, conference presentations, internal documents, and academic papers. |
[Other Consultation Types]
• Organization of Excel data, sheet splitting, and sheet merging
• Recoding, category consolidation, and grouping
• Data screening, checking missing values, and checking outliers
• Collection of data from government statistics
• Entry, digitization, and aggregation of questionnaire response forms
• Formatting tables and figures for journal submissions
• Restructuring of graphs and tables for conference presentations
• Review of AI-generated summary tables and graphs
• Refinement of AI-generated explanatory text into natural, specialist language
• Design, font, and color adjustments to match existing materials
We also accept aggregation, processing, and partial requests not listed in the examples above.
You may request only data digitization, aggregation, graph creation, or polishing of AI-generated or existing output..
Depth of Aggregation and Visualization Support
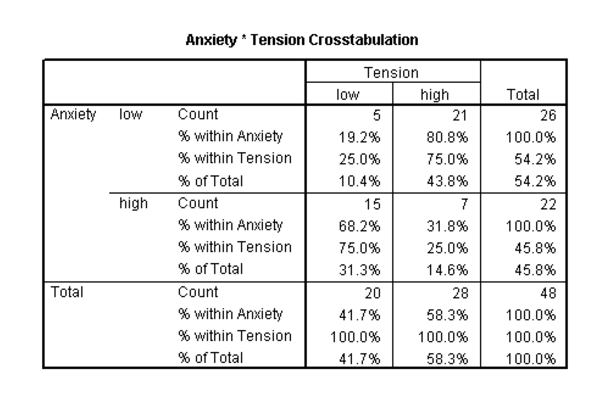
[Examples of Levels of Aggregation, Visualization, and Data-Processing Support]
•Basic Aggregation SupportSimple aggregation, table creation, record-count verification, percentage calculations, and basic Excel organization
•Standard Aggregation SupportCross-tabulation, descriptive statistics, graph creation, and digitization of paper-based data
•Data-Processing SupportChecking missing values, recoding, sheet merging, item organization, and standardization of significant digits
•Support for Research and Reporting MaterialsFormatting of tables and graphs for academic papers, conference presentations, and internal reports
•AI-Aggregation Polishing SupportRefinement of AI-generated summary tables, graphs, and explanatory text into academically and practically appropriate forms
•Restructuring of Existing MaterialsReorganization of existing graphs and tables into readable and persuasive materials
What matters in aggregation and visualization is not merely listing data, but organizing it according to the objective and presenting it in a form that communicates clearly. For this reason, we emphasize support that includes aggregation conditions, graph formats, and readability of the overall document.
Customizing Your Request
For aggregation, visualization, and data-processing support,we provide flexible customization according to data format, sample size, number of items, aggregation objective, graph format, and delivery format.We can organize outputs for research objectives, manuscripts, internal reports, conference presentations, marketing materials, and other uses.
| Customization Item | Description |
|---|---|
| Electronic and Paper-Based Data Supported | In addition to electronic data such as Excel, we can digitize paper response forms and materials and then aggregate and visualize them. |
| Specification of Aggregation Conditions | Conditions can be defined according to the objective, such as extracting only specific values, aggregating by participant attributes, aggregating by groups, or aggregating only selected items. |
| Specification of Graph Format | We create pie charts, bar charts, histograms, scatterplots, stacked bar charts, radar charts, and other requested formats. |
| Formatting and Design Adjustment | We adjust graph size, color scheme, fonts, significant digits, decimal places, legends, axis labels, and related details according to the intended use. |
| Review of AI-Generated Aggregation Results | For summary tables and graphs created with AI, we polish aggregation conditions, numerical consistency, presentation, and naturalness of explanatory text. |
| Partial Requests | We also accept partial requests such as data entry only, table creation only, graph creation only, revision of existing graphs only, or data processing only. |
The scope of support and whether additional fees apply vary depending on the request. If you provide the sample size, number of items, data format, aggregation objective, and desired graph format, we can give more appropriate guidance.
Indicative Fees
| Item | Description | Notes |
|---|---|---|
| Simple Aggregation and Table Creation | Sample size of 50 or fewer; 5 or fewer variables \9,800 |
Estimated base pricing assuming electronic data. |
| Simple Aggregation and Table Creation from Paper-Based Data | Sample size of 50 or fewer; 5 or fewer variables \14,800 |
Estimated pricing when digitization of paper-based data is required. |
| Histogram Creation | Sample size of 50 or fewer; 5 or fewer variables \9,800 |
Estimated base pricing assuming electronic data. |
| Histogram Creation from Paper-Based Data | Sample size of 50 or fewer; 5 or fewer variables \14,800 |
Estimated pricing when digitization of paper-based data is required. |
| Cross-Tabulation and Multiple Graph Creation | Quoted individually | Pricing is quoted according to aggregation dimensions, number of items, number of graphs, and scope of processing. |
| Polishing of AI-Generated Aggregation and Graphs | Quoted individually | Review of AI-generated summary tables, graphs, and explanatory text is quoted according to the content. |
| When pricing may vary | Additional pricing may apply for larger samples, more items, greater volumes of paper-based data, more graphs, or additional design adjustments. | If the scope is difficult to estimate, simply tell us the approximate scale and we can provide guidance. |
| Check the Fee Schedule | → View the Fee Schedule | You can also review other analytical and related services. |
You may contact us at the stage of “I want advice on how to aggregate this dataset” or “I want a professional review of tables or graphs produced by AI.”.
If you let us know the sample size, number of items, data format, aggregation objective, and preferred graph format, we can provide more specific guidance.
Contact Us
Over 30,000 consultations / Over 19,000 completed engagementsWe have supported consultations and requests involving analysis outsourcing, statistical processing, survey research, marketing support, and related services. Our experienced consultants carefully listen to your needs andData organization, summary-table creation, graphing, digitization of paper-based data, and review of AI-generated aggregationStat Agent team members across Japan take responsibility for supporting our clients.
*We provide the profile of the person responsible for your project when you place an order.
For aggregation, visualization, and data processing, contact Stat Agent.
*When order volume is high, it may be difficult to reach us by phone.
We apologize for the inconvenience. We respond in order of receipt, so if your matter is urgent, please contact us by
