
How to Write Statistical Analysis Results — Descriptive Statistics
For those unsure how to report means, standard deviations, medians, and proportions in undergraduate theses, master's theses, journal articles, or research reports
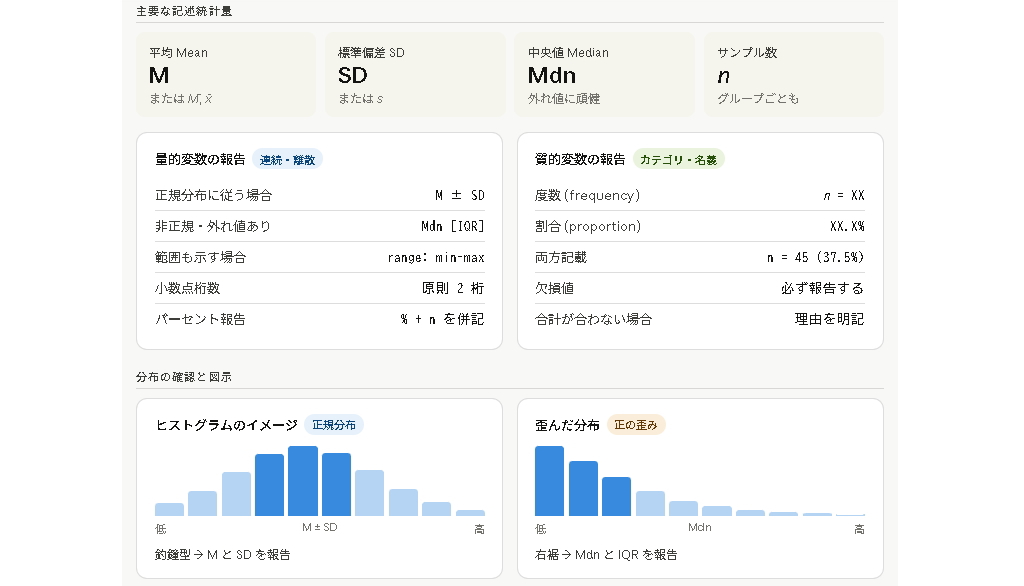
When people think of statistical analysis, they often focus on tests and models such as t-tests, ANOVA, correlation, regression, and logistic regression. However, what readers often examine first in a paper or research report is descriptive statistics that characterize the participants and data . If means, standard deviations, medians, interquartile ranges, counts, percentages, minimums, and maximums are not reported appropriately, the later hypothesis tests and discussion will also be less persuasive.
Descriptive statistics are not merely summary totals. They provide foundational information for understanding the population studied, whether the data are skewed, whether baseline characteristics differ between groups, and whether the dataset is ready for analysis. In undergraduate theses, master's theses, doctoral dissertations, journal articles, medical papers, nursing research, psychology, education, social surveys, and questionnaire analysis, how descriptive statistics are tabulated and explained in the text is extremely important.
This article is intended for readers considering how to write descriptive statistics、 how to write statistical analysis results、 how to report mean and standard deviation、 how to report median and interquartile range、 descriptive statistics in papers、 descriptive statistics undergraduate thesis、 SPSS descriptive statistics、 R descriptive statistics For readers searching for topics such as these, this article explains the fundamentals of descriptive statistics and how to report them in academic writing.
The first point to understand is that Descriptive statistics are not a simple summary before analysis; they are the foundation for reading and interpreting research results . Reporting only a mean, only a p-value, or only a graph is not enough. Depending on the data type, researchers should appropriately use mean and standard deviation, median and interquartile range, counts and percentages, and related summaries.
- • What Are Descriptive Statistics?
- • Data Types to Check First in Descriptive Statistics
- • How to Report Means and Standard Deviations
- • How to Report Medians and Interquartile Ranges
- • How to Report Counts, Proportions, and Percentages
- • How to Show Minimum, Maximum, and Range
- • How to Write Descriptive Statistics for Questionnaire Surveys
- • How to Prepare Table 1 in Medical Papers and Nursing Research
- • Converting SPSS, R, and Excel Output into Publication-Ready Tables
- • Examples of Descriptive Statistics in the Main Text
- • Common Descriptive Statistics Reporting Mistakes
- • Descriptive Statistics Support Available from Stat Agent
- • Frequently Asked Questions
- • Summary
What Are Descriptive Statistics?
Descriptive statistics summarize and present the characteristics of collected data in an understandable form. Typical measures include the mean, standard deviation, median, interquartile range, minimum, maximum, counts, percentages, and frequency distributions. They are used to describe variables such as age, sex, school year, occupation, disease status, scale scores, test scores, and satisfaction.
Descriptive statistics are the starting point of research. They help show what kind of participants produced the data, how variables are distributed, whether outliers or missing values are present, and whether baseline characteristics are imbalanced before group comparisons. Careful descriptive reporting is therefore a prerequisite for readers to interpret subsequent statistical analyses correctly .
Difference from Inferential Statistics
Inferential statistics uses sample data to make inferences about a population. t-Tests, ANOVA, chi-square tests, correlation analysis, regression, and related methods are examples of inferential statistics. Descriptive statistics, by contrast, summarize the data actually observed.
For example, stating that "the mean age of 100 participants was 21.4 years" is descriptive statistics. Examining whether the mean age differs statistically between Group A and Group B is inferential statistics. Papers should distinguish these roles rather than mixing descriptive and inferential statistics.
Why Descriptive Statistics Matter in Academic Papers
Readers usually begin by examining participant characteristics and the overall state of the data. In medical papers and nursing research, participant background is often presented as Table 1, including age, sex, disease characteristics, and the composition of intervention and control groups. In the social sciences, education, and psychology, researchers commonly report participant attributes, mean scale scores, standard deviations, and response patterns.
If descriptive statistics are inadequate, readers cannot judge what kind of data produced the study's conclusions. Descriptive statistics are therefore an important element of research transparency.
Data Types to Check First in Descriptive Statistics
Before reporting descriptive statistics, identify the variable type. Continuous, categorical, ordinal, and binary variables require different summaries. Continuous variables such as age, height, weight, and test scores may be summarized using means and standard deviations. Categorical variables such as sex, affiliation, disease status, and response categories are summarized using counts and percentages.
| Variable Type | Common Descriptive Statistics |
|---|---|
| Continuous Variables | Mean ± standard deviation, median [interquartile range], minimum, maximum |
| Categorical Variables | Counts, percentages, frequency distribution |
| Ordinal Variables | Median, interquartile range, counts and percentages for each response option |
| Binary Variables | Counts and percentages for yes/no, applicable/not applicable, success/failure, etc. |
The important point is that not every variable should be summarized with a mean. Mechanically reporting means for nominal or ordinal data can make the results difficult to interpret. Select the appropriate summary based on the research objective, level of measurement, conventions in previous studies, and the target journal's requirements.
How to Report Means and Standard Deviations
The mean is a representative measure of central tendency. The standard deviation indicates how widely values are dispersed around the mean. In papers, continuous variables are often reported in the form "mean ± standard deviation."
When to Use Mean ± Standard Deviation
Mean ± standard deviation is convenient when the distribution is not extremely skewed and the variable can reasonably be interpreted as continuous. It may be used for age, height, weight, test scores, scale scores, blood pressure, and similar variables. In the text, for example: "The mean age of participants was 21.4 ± 2.3 years."
When reporting by group, a sentence such as "The mean score was 82.4 ± 10.2 in the intervention group and 75.1 ± 11.8 in the control group" communicates both the level and variability in each group. In tables, label the column clearly as "Mean ± SD" or an equivalent expression.
Why the Mean Should Not Be Reported Alone
A mean alone does not show how dispersed the data are. For example, a mean score of 70 has a different meaning if everyone scores near 70 than if scores of 30 and 100 are both common. Reporting the standard deviation or range helps readers understand the spread of the data.
When reporting a mean, papers generally include an indicator of variability or estimation uncertainty, such as the standard deviation, standard error, or confidence interval. In undergraduate and master's theses, a good starting principle is to report the mean together with the standard deviation.
How to Report Medians and Interquartile Ranges
The median is the middle value when data are ordered from smallest to largest. The interquartile range spans the first to third quartiles and represents the middle 50% of the data. For skewed distributions or data strongly affected by outliers, the median and interquartile range may be more appropriate than the mean.
Variables such as length of hospital stay, income, number of uses, reaction time, medical expenses, and access counts often have right-skewed distributions. In such cases, a statement such as "The median length of stay was 7 days [interquartile range: 4–12 days]" may be appropriate.
Possible formats include "median [interquartile range]," "median [IQR]," or "median (first quartile–third quartile)." Whichever format is used, its meaning should be clarified in a table footnote or in Methods.
How to Report Counts, Proportions, and Percentages
Categorical variables such as sex, school year, affiliation, disease status, smoking status, and response category are reported using counts and percentages. For example: "There were 45 men (45.0%) and 55 women (55.0%)."
When reporting a percentage, it is important to make the denominator clear. The meaning differs depending on whether the percentage is based on all 100 participants, 95 valid respondents, or 50 people in a particular group. In tables, use a heading such as "n (%)" and specify the denominator when necessary.
Use a consistent number of decimal places for percentages throughout the paper. For example, reporting 45.0%, 12.5%, and 3.2% to one decimal place improves readability. When the sample is small, always report counts in addition to percentages.
How to Show Minimum, Maximum, and Range
Minimum and maximum values are used to show the range of the data. For example, reporting participant ages as "18–24 years" shows the age span. Minimum and maximum alone do not show the center or variability of the distribution, so they are often reported together with a mean or median.
For example, "The mean age was 21.4 ± 2.3 years, with a range of 18–29 years" communicates central tendency, variability, and range simultaneously. When outliers are present, a box plot or interquartile range may also be used to show the distribution.
Undergraduate and master's theses do not need to report minimum and maximum values for every variable. Limiting them to variables for which distribution or range is important keeps tables easier to read.
How to Write Descriptive Statistics for Questionnaire Surveys
Questionnaire studies may report respondent characteristics, response distributions for individual items, means and standard deviations of scale scores, and reliability coefficients. For five-point items, one approach is to report the count and percentage for each option; another is to summarize a composite scale made from multiple items using a mean and standard deviation.
Reporting only the mean for a single five-point item can conceal the shape of the response distribution. For a multi-item scale, however, a total or mean score may be used after reverse-scored items are processed and reliability is assessed.
For descriptive statistics in questionnaire research, clearly reporting the number of respondents, number of valid responses, missing values, percentage selecting each option, and the method used to calculate scale scores makes the results easier for readers to understand.
How to Prepare Table 1 in Medical Papers and Nursing Research
Medical papers and nursing studies often present participant background as Table 1. This may include age, sex, BMI, disease characteristics, medical history, intervention/control group, severity, and baseline values. The table not only describes the study population but also helps readers assess the basis for between-group comparisons.
| Item | Examples of Table 1 Reporting |
|---|---|
| Age | Mean ± standard deviation or median [interquartile range] |
| Gender | Men n (%), women n (%) |
| Disease / Medical History | Present n (%), absent n (%) |
| Laboratory Values | Mean ± standard deviation or median [interquartile range], depending on the distribution |
| Group Comparisons | Report p-values when appropriate, considering the purpose of the table. |
Use an appropriate summary for each variable in Table 1 and explain units and abbreviations in footnotes. If p-values for group comparisons are included, the Methods section should state which statistical tests were used.
Converting SPSS, R, and Excel Output into Publication-Ready Tables
SPSS, R, Excel, and similar tools often produce many numerical outputs for descriptive statistics. In many cases, however, software output tables should not be pasted directly into a paper because they may contain unnecessary columns or labels that are difficult for readers to understand.
When preparing a publication-ready table, select only indicators needed for the research objective. For example, report age as mean ± standard deviation, sex as counts and percentages, and a skewed laboratory value as median [interquartile range]. Consistent decimal places, units, variable names, footnotes, and group labels improve readability.
Using R makes it easier to preserve code for reproducibility. With SPSS, saving Syntax or a record of menu operations together with the output helps when revision or reanalysis is needed. In Excel, take care to avoid data-entry and formula-range errors, and keep raw data separate from summary tables.
Examples of Descriptive Statistics in the Main Text
Key descriptive findings should be explained in the text as well as shown in tables. There is no need to repeat every number from a table. Focus on major characteristics relevant to the research objective and points necessary for understanding the results.
- The mean age of the 100 participants was 21.4 ± 2.3 years, and 55 participants (55.0%) were women.
- The mean score was 3.82 ± 0.64 for Scale A and 3.41 ± 0.72 for Scale B.
- The median length of hospital stay was 7 days [interquartile range: 4–12 days].
- There were 312 valid responses, corresponding to a valid-response rate of 78.0%.
- Baseline characteristics of the intervention and control groups are shown in Table 1.
Textual descriptions should be concise. Rather than converting every number in a table into sentences, use descriptive statistics in the text to orient readers to the key findings.
Common Descriptive Statistics Reporting Mistakes
Common problems include reporting only means, reporting only percentages, failing to specify denominators, omitting units, and using summaries that do not match the data type. These may appear minor but can affect the readability and credibility of the entire paper.
- Reporting a mean without a standard deviation or range
- Reporting percentages without counts
- Failing to clarify whether the denominator is the full sample or only valid respondents
- Forcing a nominal variable into a mean-based summary
- Reporting a median without an interquartile range
- Using inconsistent decimal places within the same table
- Failing to explain units or abbreviations
- Numbers in the table and main text do not match
Because descriptive statistics are basic, inconsistencies can stand out strongly. In undergraduate theses, master's theses, and journal submissions, carefully check agreement between tables and text, rounding, units, missing data, and denominators.
Descriptive Statistics Support Available from Stat Agent
Stat Agent supports descriptive statistics, questionnaire tabulation, cross-tabulation, graph preparation, table preparation, and organization of SPSS, R, and Excel output for undergraduate theses, master's theses, doctoral dissertations, journal articles, medical papers, nursing research, psychology, education, social surveys, business studies, local-government research, and more.
For descriptive statistics in particular, we check means, standard deviations, medians, interquartile ranges, counts, percentages, missing values, denominators, and decimal places and organize the results into a form that can be used readily in papers and reports.
We can provide specific support if you want to format SPSS output for a paper, make questionnaire results easier to read, are unsure whether to use a mean or median, need to prepare Table 1, or want to refine the descriptive-statistics text in Results.
Frequently Asked Questions
Q1. Is reporting the mean alone sufficient for descriptive statistics?
Usually not. A mean alone does not show variability, so the standard deviation is commonly reported as well. For skewed distributions, the median and interquartile range may be more appropriate than the mean.
Q2. Do I need to report counts when I report percentages?
Yes. Percentages without counts make the denominator unclear and can be difficult to interpret. Papers commonly report both, for example "45 participants (45.0%)."
Q3. Can a five-point questionnaire be summarized using means?
It depends on the research objective and how the scale is treated. For a single item, counts and percentages for each response option may be more informative. For a composite scale constructed from multiple items, reporting a mean and standard deviation may be appropriate.
Q4. Can I paste SPSS or Excel tables directly into a paper?
It is generally better to reformat them for publication. Removing unnecessary columns and standardizing variable names, units, counts, percentages, decimal places, and footnotes produces tables that are easier for readers to understand.
Q5. Do descriptive statistics require p-values?
Descriptive statistics summarize data, so p-values are not always necessary. If between-group comparisons are performed, p-values may be reported as appropriate. The important point is to clarify whether the table's purpose is descriptive characterization or hypothesis testing between groups.
Summary | Descriptive Statistics Are the Foundation for Interpreting Statistical Results
Descriptive statistics are the most fundamental but also one of the most important parts of statistical reporting. Appropriate use of means, standard deviations, medians, interquartile ranges, counts, percentages, minimums, and maximums allows readers to understand the characteristics of the study population and data accurately.
In descriptive statistics, choose summaries that fit the data type and check denominators, units, missing values, decimal places, and consistency between tables and text . Moving on to inferential statistics only after these foundations are established improves the persuasiveness of the paper or research report as a whole.
Stat Agent supports descriptive statistics, questionnaire tabulation, organization of SPSS/R/Excel output, Table 1 preparation, graphing, and assistance with Methods and Results text. I want to improve my descriptive-statistics tables、 I am unsure when to use a mean versus a median、 I want results written in a form suitable for an undergraduate thesis, master's thesis, or journal article Please feel free to contact us in these situations.
