
DEMATEL and Affinity Diagramming (KJ Method)
For those who want to organize complex factors and visualize causal structures in undergraduate theses, master’s theses, doctoral dissertations, journal submissions, corporate research, and policy studies
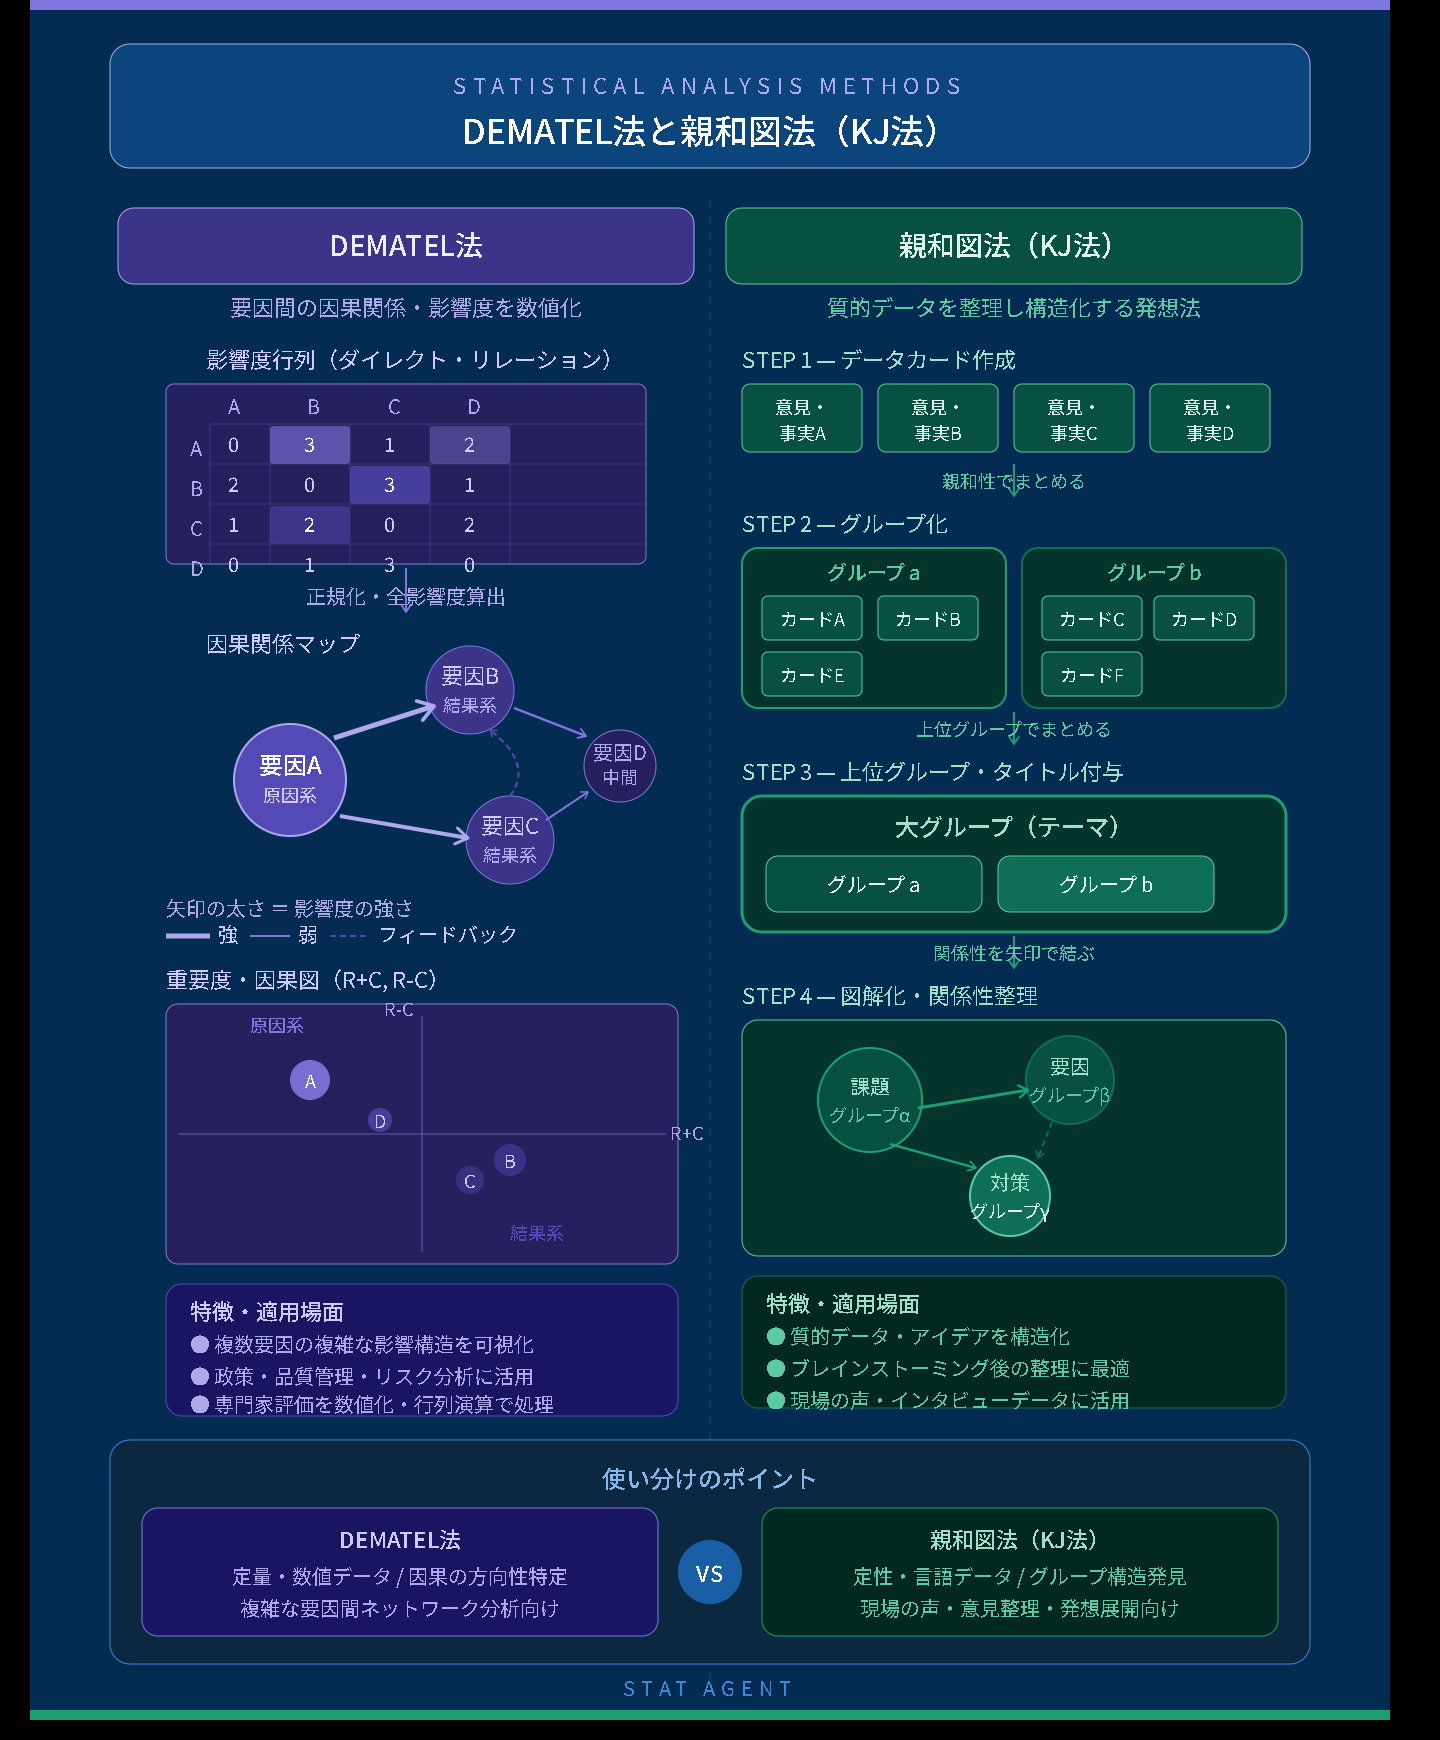
Research and practical investigations often address topics in which multiple factors are intricately interconnected. For example, in organizational issues, regional challenges, improvements in medical and nursing settings, educational issues, customer satisfaction, design management, tourism promotion, disaster preparedness, welfare services, and marketing strategy, the overall problem often cannot be explained by simple one-to-one relationships.
Useful approaches in such situations include affinity diagramming (the KJ Method) and DEMATEL. Affinity diagramming (the KJ Method) organizes opinions and narratives obtained from open-ended responses, interviews, and workshops by grouping semantically similar content. DEMATEL, by contrast, quantifies influence relationships among factors and visualizes causal factors, resulting factors, and central factors.
In particular, diverse views obtained through qualitative research can first be organized using affinity diagramming (the KJ Method),and the major factors identified there can then be analyzed as a causal structure using DEMATEL. This sequence is useful when moving from exploratory to empirical research.
This article is intended for readers considering DEMATEL.、 affinity diagramming、 KJ Method、 causal-structure analysis、 factor analysis、 Qualitative Analysis、 survey analysis、 expert evaluation、 research design For readers searching for these topics, this article explains the fundamentals of DEMATEL and affinity diagramming (the KJ Method), their differences, how to combine them, how to report them in papers, and key analytical considerations.
The first point to understand is that Affinity diagramming (the KJ Method) is “a method for identifying factors and creating meaningful groupings,” whereas DEMATEL is “a method for quantifying influence relationships among factors and visualizing them as a structure.” Combining the two allows complex insights from open-ended responses and interviews to be organized into an analytical model that is easier to explain in research papers and reports.
- • What is DEMATEL?
- • What is affinity diagramming (the KJ Method)?
- • Differences between DEMATEL and affinity diagramming (the KJ Method)
- • Analytical procedure for combining DEMATEL and the KJ Method
- • Examples of application to research topics
- • Use in surveys and expert evaluations
- • How to interpret DEMATEL calculation results
- • How to write the Methods and Results sections
- • Analytical cautions and limitations
- • Analytical support available from Stat Agent
- • Frequently Asked Questions
- • Summary
What is DEMATEL?
DEMATEL is a structural-analysis method for clarifying how multiple factors influence one another. DEMATEL stands for Decision Making Trial and Evaluation Laboratory and is used to organize direct and indirect influence relationships among factors that constitute a complex problem.
In DEMATEL, the factors to be analyzed are first defined, and the degree to which each factor influences the others is evaluated. Evaluations are often obtained through pairwise comparisons by experts, practitioners, research collaborators, or other relevant participants—for example, by asking “To what extent does Factor A influence Factor B?” on an ordinal scale.
The resulting evaluations are then organized into a matrix, and a total-relation matrix is calculated to incorporate both direct and indirect effects. This makes it possible to visualize which factors strongly drive other factors and which factors tend to be affected as outcomes.
What DEMATEL can reveal
DEMATEL reveals more than the importance of individual factors. Rather than simply ranking “important factors,” it characteristically identifies the direction and strength of influence, causal-side factors, effect-side factors, and central factors in the overall network. These structural relationships can be examined together.
For example, in a study of organizational reform involving “human-resource development,” “managerial awareness,” “evaluation systems,” “workplace climate,” and “turnover intention,” DEMATEL can help identify which factors serve as starting points that influence the others. This makes it easier to focus improvement measures on factors closer to root causes rather than on superficial outcomes.
Prominence and relation (cause degree)
DEMATEL commonly uses indices known as prominence and relation. Prominence indicates the extent to which a factor is connected with the overall network. A factor with high prominence has strong relationships with other factors and may occupy a central position in the problem structure.
Relation indicates whether a factor tends primarily to influence other factors or to be influenced by them. A positive relation value is generally interpreted as placing the factor relatively on the “cause” side, whereas a negative value places it relatively on the “effect” side.
What is affinity diagramming (the KJ Method)?
Affinity diagramming (the KJ Method) organizes large numbers of opinions, open-ended responses, observation records, interview content, field notes, and other fragmented information according to semantic similarity. Information is placed on cards or equivalent units, compared, grouped by similarity, and assigned group labels, making the structure of complex phenomena easier to understand.
Affinity diagramming (the KJ Method) is often used in the early stages of qualitative research and problem organization. Simply reading participants’ narratives may not make the main issues apparent. By dividing statements into meaning units and grouping similar content, researchers can identify factors and categories related to the research topic.
For example, when analyzing open-ended responses about students’ learning difficulties, statements such as “the class content is difficult,” “it is hard to ask questions,” “there is too much coursework,” “I cannot picture my future,” and “I am anxious about friendships” can be treated as cards and classified by meaning. This can yield categories such as “difficulty understanding learning content,” “lack of a supportive consultation environment,” “time burden,” “career anxiety,” and “interpersonal anxiety.”
Differences between DEMATEL and affinity diagramming (the KJ Method)
Both DEMATEL and affinity diagramming (the KJ Method) are useful for organizing complex problems, but they serve different roles. Affinity diagramming primarily organizes qualitative data and extracts factors or categories. DEMATEL, by contrast, quantifies influence relationships among the extracted factors and visualizes them as a causal structure.
Difference between qualitative organization and structural analysis
Affinity diagramming (the KJ Method) is particularly useful at the stage of organizing meanings contained in open-ended responses and interview data. It is appropriate when factors have not yet been clearly identified, when researchers wish to explore the overall picture of the research subject, or when diverse opinions need to be classified.
DEMATEL is used after factors have become reasonably clear, at the stage of analyzing the influence relationships among them. In this sense, affinity diagramming (the KJ Method) is a method for “identifying factors,” whereas DEMATEL is a method for “structuring relationships among factors.”
Benefits of combining the two methods
The greatest benefit of combining the two approaches is that factors grounded in qualitative field data can then be explained quantitatively and structurally. Affinity diagramming alone may not clearly indicate which categories are on the causal side and which are on the effect side. Conversely, DEMATEL alone may provide a weak explanation of how the factors selected for analysis were originally identified.
By first extracting factors through affinity diagramming (the KJ Method) and then analyzing causal structure with DEMATEL, “factor extraction grounded in field voices” and “visualization of relationships among factors” can be presented as an integrated analytical process.
Analytical procedure for combining DEMATEL and the KJ Method
When combining DEMATEL and affinity diagramming (the KJ Method), the analysis generally proceeds as follows. First, information about the research subject is collected through interviews, open-ended surveys, workshops, prior-literature reviews, or similar methods. Next, the resulting statements are divided into meaning units and similar content is grouped using affinity diagramming.
| Stage | Main Task |
|---|---|
| 1. Data collection | Collect interviews, open-ended responses, literature, workshop records, and related material |
| 2. Organization using the KJ Method | Divide the data into meaning units and group similar content |
| 3. Factor extraction | Assign category labels and determine the major factors to be used in DEMATEL |
| 4. Evaluation of influence relationships | Ask experts or participants to evaluate the presence and strength of influence among factors |
| 5. DEMATEL analysis | Calculate the direct-relation matrix, total-relation matrix, prominence, and relation |
| 6. Interpretation of causal structure | Interpret causal-side factors, effect-side factors, and central factors, and visualize them in figures or tables |
This process connects exploratory qualitative analysis with structured quantitative analysis. In undergraduate theses, master’s theses, and doctoral dissertations, analytical transparency can be improved by clearly describing the research objective, participants, factor-extraction procedure, evaluator characteristics, rating scale, and analytical procedure.
Examples of application to research topics
DEMATEL and affinity diagramming (the KJ Method) are suitable for studies addressing complex social and organizational issues. They are particularly useful when multiple factors interact and simple tabulation or correlation analysis is insufficient to explain the overall structure.
| Research field | Example applications |
|---|---|
| Management studies | Structuring factors in design management, organizational reform, turnover, customer satisfaction, and digital-transformation promotion |
| Education | Organizing factors related to learning motivation, class improvement, school-refusal support, and declining interest in becoming a teacher |
| Medicine and nursing | Analyzing factors related to workload, team-based care, patient safety, and nurses’ psychological burden |
| Welfare and regional policy | Structural analysis of issues in community-based integrated care, child support, disability support, and municipal policies |
| Marketing | Analysis of purchasing behavior, brand evaluation, service satisfaction, and factors shaping word of mouth |
For example, in a study of regional revitalization, resident interviews and interviews with municipal staff can be organized using affinity diagramming to identify factors such as “transportation convenience,” “awareness of regional resources,” “shortage of local actors,” “information dissemination,” and “administrative collaboration.” DEMATEL can then be used to analyze which factors influence others, helping researchers consider policy priorities.
Use in surveys and expert evaluations
DEMATEL may use surveys or expert evaluations to assess influence relationships among factors. Respondents are asked to rate each pair of factors in terms of “how strongly one influences the other.” The exact rating scale varies by study, but it is common to use ordered levels ranging from no influence to strong influence.
The choice of evaluators is closely related to study validity. For example, when examining operational improvement in healthcare settings, evaluators should understand the topic well and may include physicians, nurses, managers, and medical administrative staff. For management issues, researchers should consider how to incorporate the perspectives of executives, managers, frontline staff, and outside experts.
When factors extracted through affinity diagramming are used directly in DEMATEL, care is needed to avoid including too many factors. As the number of factors increases, the number of pairwise evaluations also increases, increasing respondent burden. It is therefore important to select the major factors in light of the research objective and design the questionnaire clearly.
How to interpret DEMATEL calculation results
When interpreting DEMATEL results, it is necessary to understand relationships among factors as a structure rather than merely comparing numerical magnitudes. Common outputs include the direct-relation matrix, total-relation matrix, dispatching influence, receiving influence, prominence, and relation.
| Index | Meaning |
|---|---|
| Dispatching influence | Indicates how strongly a factor influences other factors |
| Receiving influence | Indicates how strongly a factor is influenced by other factors |
| Prominence | The sum of dispatching and receiving influence, indicating the overall strength of a factor’s relationships within the structure |
| Relation | An index used to determine whether a factor is primarily an influencing factor or an influenced factor |
| Causal-structure diagram | A visualization of influence relationships among factors using arrows or a network diagram |
Factors with high prominence may occupy important positions in the problem structure. Factors with high positive relation values are often interpreted as starting points that influence other factors and may become priority targets for interventions or measures. Factors with low relation and high receiving influence, by contrast, may emerge as outcomes of multiple upstream factors.
How to write the Methods and Results sections
When DEMATEL and affinity diagramming (the KJ Method) are used in a paper, the Methods section should clearly explain the analytical procedure, while the Results section should separately present the factor-extraction results and causal-structure results. In particular, it is important to state what data were used to extract factors, who performed the classification, and how category labels were determined.
- Open-ended response data or interview data were divided into meaning units.
- Using affinity diagramming (the KJ Method), similar statements were grouped and major categories were identified.
- The identified categories were defined as factors for DEMATEL analysis.
- Experts or participants were asked to rate the influence relationships among factors using an ordinal scale.
- The ratings were organized into a matrix, and the total-relation matrix, prominence, and relation were calculated.
- The causal structure among factors was interpreted based on prominence and relation.
In the Results section, it is effective to show a list of categories identified through affinity diagramming, a table of DEMATEL prominence and relation values, and a causal-structure diagram. In the Discussion, causal-side factors should be interpreted in terms of their meaning for the research topic, while effect-side factors should be discussed as observed phenomena in relation to prior literature and field context.
Analytical cautions and limitations
DEMATEL and affinity diagramming (the KJ Method) are useful methods, but they also have limitations. In affinity diagramming, analyst judgment is involved in classification and category naming. Analytical transparency can therefore be improved by defining classification criteria clearly, having multiple people review the categorization, and presenting representative examples of statements.
In DEMATEL, influence relationships among factors are based on evaluator judgment, so evaluator selection is important. Asking respondents with limited expertise to evaluate complex relationships may reduce reliability. In addition, causal relationships shown by DEMATEL do not represent rigorous causal effects in the sense of experimental research.
Accordingly, in a paper it is important not to confuse “relationships interpreted as causal structure” with “causal effects established through rigorous statistical causal inference.” DEMATEL is best positioned as a method for organizing complex problems and supporting hypothesis generation or consideration of interventions, which allows the research to be described appropriately.
Analytical support available from Stat Agent
Stat Agent provides support for DEMATEL, affinity diagramming (the KJ Method), qualitative analysis, survey analysis, expert evaluation, causal-structure diagram creation, interpretation of results, and reporting in papers and reports for undergraduate theses, master’s theses, doctoral dissertations, journal submissions, medical papers, nursing research, education research, management research, social surveys, municipal surveys, and corporate studies.
When DEMATEL and affinity diagramming are combined in particular, we can support the full process from factor extraction, category organization, questionnaire design, rating-scale design, matrix-data preparation, calculation of prominence and relation, visualization of causal-structure diagrams, and writing of the Methods, Results, and Discussion sections. This process can be organized consistently from beginning to end.
We can also provide specific consultation for concerns such as “I do not know how to organize open-ended responses using the KJ Method,” “I am unsure about DEMATEL calculations or table creation,” “I do not know how to write the interpretation of prominence and relation in my paper,” or “I want an analysis design suitable for a doctoral dissertation or journal submission,” according to your research objective and data.
Frequently Asked Questions
Q1. Are DEMATEL and the KJ Method the same analytical method?
No. Affinity diagramming (the KJ Method) organizes qualitative data such as open-ended responses and interviews to identify factors or categories. DEMATEL quantifies influence relationships among the identified factors and visualizes them as a causal structure.
Q2. Can categories identified using the KJ Method be used in DEMATEL?
Yes. In fact, using categories derived from qualitative data as DEMATEL factors can make it easier to analyze a causal structure grounded in actual field conditions. However, too many factors increase evaluation burden, so it is important to narrow them down to major factors.
Q3. Is DEMATEL a statistical analysis?
DEMATEL organizes influence relationships among factors in matrix form and analyzes their structure. Although it differs from conventional methods such as t-tests and regression analysis, it uses numerical data to analyze influence relationships and is treated as a structural-analysis method in research reports and academic papers.
Q4. Can DEMATEL alone prove causality?
No. DEMATEL does not establish causal effects in the strict sense. It visualizes an influence structure among factors based on expert evaluation or survey results. It should be interpreted separately from methods that directly test causal effects, such as experimental or longitudinal research.
Q5. Can DEMATEL and the KJ Method be used in undergraduate or master’s theses?
Yes. However, the research objective, participants, data-collection method, factor-extraction procedure, evaluator selection, and analytical procedure need to be clearly defined. The analysis should be designed at a manageable level consistent with the supervisor’s policy and conventions in the research field.
Summary | DEMATEL and affinity diagramming (the KJ Method) are an effective combination for organizing complex factors as research
DEMATEL and affinity diagramming are effective methods for organizing complex problems into a form that can be explained as research. Affinity diagramming is useful for extracting factors or categories from qualitative data such as open-ended responses and interviews. DEMATEL is useful for quantifying influence relationships among those factors and organizing them in terms of prominence, relation, and a causal-structure diagram.
By combining the two methods, researchers can begin with field voices and qualitative data, visualize the structure among factors, and present the findings persuasively in academic papers and reports. This combination is particularly useful for themes involving multiple interacting factors in fields such as management, education, medicine and nursing, welfare, regional policy, marketing, and design management.
Stat Agent provides support for DEMATEL, affinity diagramming (the KJ Method), qualitative analysis, questionnaire design, expert evaluation, causal-structure diagram creation, statistical analysis, and reporting in academic papers and reports. I want to organize a complex research topic.、 I want to summarize open-ended responses or interview findings using the KJ Method.、 I want to visualize influence structures among factors using DEMATEL. Please feel free to contact us in these situations.
