
Building Structural Equation Models (SEM)
For those who want to test hypothesis models containing latent variables and present path diagrams, fit indices, and standardized coefficients persuasively in undergraduate theses, master’s theses, doctoral dissertations, and journal submissions
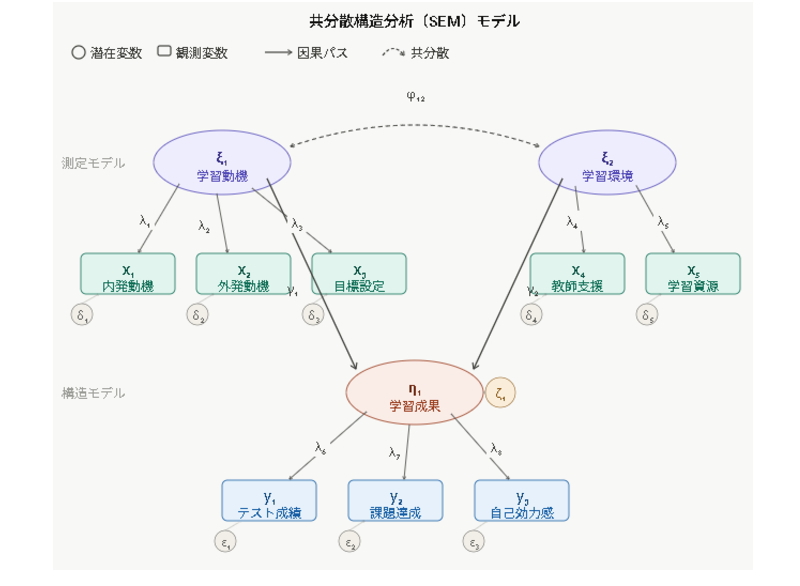
Structural Equation Modeling (SEM) is a multivariable analytical method widely used in psychology, education, nursing, medical research, social welfare, management, marketing, tourism research, and organizational studies. SEM can address not only observed questionnaire items and scale scores but also underlying latent variables, allowing relationships among variables to be examined simultaneously.
For example, SEM is useful in studies testing hypotheses such as “greater psychological ownership increases well-being,” “learning motivation influences intention to continue through course satisfaction,” or “workplace climate reduces turnover intention through psychological safety,” because multiple relationships can be tested within a single hypothesis model rather than only through simple correlation or multiple regression analyses.
However, SEM requires more than simply entering data into analysis software. Researchers must consider a model specificationbased on the research hypotheses, a measurement modelthat defines the relationship between latent and observed variables, a structural modelthat represents hypothesized relationships among latent variables, and model-fit indices that indicate how well the overall model fits the data.
This article is intended for readers considering structural equation modeling、 SEM、 SEM model building、 latent variables,、 observed variables、 path diagram、 confirmatory factor analysis、 model-fit indices、 AMOS、 lavaan、 Mplus For readers searching for these topics, this article explains the fundamentals of SEM model building, the analytical workflow, how to report SEM in papers, and important cautions.
The first point to understand is that Building an SEM model is not merely the task of drawing paths in statistical software; it is the process of translating theory, prior research, scale construction, and research hypotheses into a testable specification of which variables influence which others. More important than the visual appearance of a model is being able to explain why each path was specified.
- • What is Structural Equation Modeling (SEM)?
- • What model building means in SEM
- • Defining latent and observed variables
- • Basic procedure for building an SEM model
- • Relationship to Confirmatory Factor Analysis (CFA)
- • How to interpret fit indices
- • Interpretation of path coefficients, standardized coefficients, and indirect effects
- • Cautions when modifying a model
- • How to write the Methods and Results sections
- • Common mistakes in SEM model building
- • SEM analytical support available from Stat Agent
- • Frequently Asked Questions
- • Summary
What is Structural Equation Modeling (SEM)?
Structural Equation Modeling (SEM) is a statistical method for simultaneously analyzing relationships among multiple variables. SEM can model not only relationships among observed variables but also latent variables underlying those observed measures and the relationships among the latent variables. It is therefore suitable for studies involving psychological scales, attitude scales, satisfaction scales, awareness surveys, behavioral intentions, and organizational factors.
A major feature of SEM is that it can address the measurement model and structural model simultaneously. The measurement model specifies which observed variables measure each latent variable. The structural model specifies hypothesized influence relationships among latent variables or between latent and observed variables.
What SEM can do
SEM can estimate multiple regression relationships simultaneously within a single model. For example, a model can include independent, mediating, and dependent variables and assess direct and indirect effects at the same time. Treating scales composed of multiple questionnaire items as latent variables also makes it possible to account for measurement error.
SEM can also be extended to multigroup analysis to examine whether the same model holds across groups, measurement-invariance testing, mediation analysis, and testing hierarchical hypothesis models. Undergraduate and master’s theses often begin with relatively simple path models, whereas doctoral dissertations and journal submissions may require more theoretically refined models.
Differences from regression analysis and factor analysis
Regression analysis examines the extent to which multiple independent variables are associated with a particular dependent variable. Factor analysis explores or confirms common factors underlying multiple observed variables. SEM extends these ideas by allowing factor structure and influence relationships among variables to be handled within one model.
For example, factor analysis might first confirm latent variables such as “psychological ownership,” “well-being,” and “relationship satisfaction,” after which SEM can test a model in which “psychological ownership influences well-being through relationship satisfaction.” In this way, SEM considers measurement and structural relationships together.
What model building means in SEM
Model building in SEM is the process of expressing research hypotheses as a path diagram and organizing them into a form that can be tested statistically. Researchers must decide which variables are latent, which observed variables measure them, which directional paths are specified, and how error terms and covariances are handled.
Consistency with prior research and the theoretical framework is essential when building a model. SEM software permits many paths to be specified freely, but adding unsupported paths can improve statistical fit while weakening the model’s explanatory value as research. Models should therefore be built not only by asking “does it fit well?” but also “can it be justified theoretically?”
In undergraduate theses, master’s theses, doctoral dissertations, and journal submissions in particular, it is not enough simply to show a model diagram; researchers are expected to explain in writing why each latent variable was defined, why each path was hypothesized, and why the model can answer the research objective. These points must be justified explicitly.
Defining latent and observed variables
One of the first important steps in SEM model building is defining latent and observed variables. A latent variable is a concept that cannot be observed directly but is measured through multiple questionnaire items or indicators. Examples include well-being, learning motivation, self-efficacy, psychological safety, job satisfaction, and brand attachment.
Observed variables are variables actually obtained through questionnaires or measurement. Items such as “I am satisfied with my current life,” “This class is easy to understand,” and “I feel safe expressing my opinions at work” are examples of observed variables. In SEM, it is necessary to define clearly which latent construct each observed variable measures.
Understanding the measurement model
A measurement model represents relationships between latent and observed variables. For example, when the latent construct “psychological safety” is measured by three or four questionnaire items, the path diagram shows that each item serves as an indicator of psychological safety.
Confirmatory Factor Analysis (CFA) is commonly used to examine the validity of a measurement model. Researchers assess whether each observed variable relates sufficiently to the intended latent variable, whether factor loadings are appropriate, and whether the overall model fit is acceptable.
Understanding the structural model
A structural model represents relationships among latent variables or between latent and observed variables. For example, if the hypothesis is that “psychological ownership” affects “relationship satisfaction,” which in turn affects “well-being,” directional paths are specified among these latent variables.
Structural models may examine not only direct effects but also mediation and indirect effects. The more complex the research hypotheses become, the more important it is to explain clearly why each path is specified.
Basic procedure for building an SEM model
Building an SEM model is not merely drawing a diagram in statistical software; it requires consistency among the research objective, theory, scales, data, and analytical procedure. A typical workflow is as follows.
| Stage | Main Task |
|---|---|
| 1. Organize the research hypotheses | Clarify relationships among variables based on theory and prior research |
| 2. Define latent variables | Organize the concepts studied and confirm their correspondence with scale items |
| 3. Evaluate the measurement model | Use confirmatory factor analysis to examine the correspondence between latent and observed variables |
| 4. Specify the structural model | Specify paths among latent or observed variables based on the hypotheses |
| 5. Examine model-fit indices | Review CFI, TLI, RMSEA, SRMR, χ², and related indices |
| 6. Interpret path coefficients | Review standardized coefficients, statistical significance, direct effects, and indirect effects |
| 7. Report in the paper | Organize the analytical procedure and findings in the Methods, Results, and Discussion |
Following this workflow allows SEM findings to be explained as tests addressing the research objective rather than as merely a diagram and numerical output. If the hypotheses are vague at the model-building stage, interpretation becomes difficult after analysis.
Relationship to Confirmatory Factor Analysis (CFA)
Confirmatory Factor Analysis (CFA) plays an important role in SEM model building. CFA tests whether a prespecified factor structure fits the data. Whereas exploratory factor analysis explores “what factors may exist,” CFA tests “whether the hypothesized factor structure is valid.”
When latent variables are used in SEM, researchers need to confirm that each latent variable is measured appropriately by its observed indicators. If the measurement model is unstable, interpretation of relationships among latent variables in the structural model will also be unstable. It is therefore desirable to examine factor loadings, model fit, and correlations among latent variables with CFA before proceeding to the structural model.
In a paper, stating that “the validity of the measurement model was first evaluated, followed by examination of the structural model” improves analytical transparency. Cronbach’s alpha, composite reliability, and average variance extracted may also be examined to demonstrate scale reliability and validity.
How to interpret fit indices
SEM uses multiple fit indices to assess how well the overall model corresponds to the data. Common indices include χ², CFI, TLI, RMSEA, and SRMR. It is important not to rely on a single index but to evaluate several indices together.
| model-fit indices | What to check |
|---|---|
| χ² | Assesses discrepancy between the model and the data, but is sensitive to sample size |
| CFI | Comparative fit index; generally, higher values indicate better model fit |
| TLI | A comparative index that takes model complexity into account |
| RMSEA | An index of approximate error; generally, lower values indicate better fit |
| SRMR | An index reflecting residuals between observed correlations and correlations reproduced by the model |
Fit indices do not prove that a model is completely correct. Even a model with good fit may be theoretically implausible and therefore weak as research. Conversely, when fit is somewhat weaker, interpretation should consider the research objective, sample characteristics, and theoretical meaning of the model.
Interpretation of path coefficients, standardized coefficients, and indirect effects
SEM results include coefficients for each path. A path coefficient indicates the extent of the relationship between one variable and another. Standardized coefficients make it easier to compare the relative magnitude of relationships across variables measured in different units.
For example, reporting “the standardized path coefficient from psychological ownership to well-being was .42” indicates that higher psychological ownership tends to be associated with higher well-being. However, with cross-sectional data, the direction specified in the statistical model should be distinguished from actual causal relationships.
Indirect effects are also important in SEM. For example, when A influences C through B, the direct path from A to C may be non-significant while the indirect effect through the A→B→C pathway is meaningful. Mediation analysis may use bootstrap procedures to examine confidence intervals for indirect effects.
Cautions when modifying a model
SEM models are sometimes modified using modification indices as a reference. For example, adding covariance between error terms or adding a path may improve model fit. However, a model should not be changed solely because a modification index suggests doing so.
Model modifications should be made only when they can be justified theoretically and substantively. For example, if error covariance is specified between similarly worded items within the same scale, the similarity of item content should be given as the rationale. Repeated unsupported modifications can overfit the model to the analyzed dataset and reduce its reproducibility in other data.
In a paper, it is important to state clearly the initially specified theoretical model, the reasons for any modifications, and the rationale for the final model. In journal submissions in particular, exploratory model modification should not be confused with confirmatory model testing.
How to write the Methods and Results sections
When SEM is used in a paper, the Methods section should clearly describe the rationale for model construction, analytical sample, measures, estimation method, software, missing-data handling, and fit indices. The Results section should organize the measurement model, structural model, fit indices, path coefficients, indirect effects, and related findings.
- An SEM model specifying relationships among latent variables was constructed based on prior research.
- Each latent variable was measured using the corresponding multiple observed variables.
- First, the fit of the measurement model was evaluated using confirmatory factor analysis.
- Next, the structural model was estimated and standardized path coefficients among latent variables were examined.
- Model fit was evaluated using χ², CFI, TLI, RMSEA, and SRMR.
- For mediation effects, indirect effects and their confidence intervals were examined.
In the Results section, it is important not to stop at “significant” or “not significant.” Explain which paths supported the hypotheses, which did not, and how well the overall model fit, together with appropriate tables and figures.
Common mistakes in SEM model building
A common mistake in SEM is creating an overly complex model with weak theoretical justification. Because SEM can estimate many paths simultaneously, researchers may be tempted to include numerous relationships. However, a model with too many paths is difficult to interpret and may have an unclear correspondence with the research hypotheses.
- Specifying many paths without support from prior research
- Unclear correspondence between latent and observed variables
- Proceeding to the structural model without confirmatory factor analysis
- Judging model validity solely by fit indices
- Adding unsupported paths or error covariances based only on modification indices
- Using a model that is too complex for the sample size
- Using strong causal language despite cross-sectional data
- Showing a path diagram without sufficient explanation in the Methods or Results
In SEM, it is necessary to distinguish what can be statistically estimated from what can be justified as research. A good SEM model is not merely one with high fit; it is one in which the research objective, theory, measures, data, and interpretation are coherent.
SEM analytical support available from Stat Agent
Stat Agent provides support for Structural Equation Modeling (SEM), Confirmatory Factor Analysis (CFA), path analysis, mediation analysis, multigroup analysis, scale analysis, organization of model-fit indices, path-diagram creation, result interpretation, and reporting in papers and reports for undergraduate theses, master’s theses, doctoral dissertations, journal submissions, medical papers, nursing research, psychology research, education research, management research, social surveys, and corporate studies.
For SEM model-building support in particular, we can assist with organizing research hypotheses, confirming the correspondence between latent and observed variables, constructing the measurement model, specifying the structural model, reviewing fit indices, interpreting standardized coefficients, creating figures and tables, and writing the Methods, Results, and Discussion sections. This process can be organized consistently from beginning to end.
We can also provide specific consultation for concerns such as “I do not know how to create an SEM model diagram,” “I do not know how to report results from AMOS or lavaan in my paper,” “I am unsure how to interpret fit indices,” “I want to examine mediation or multigroup analysis,” or “I want to develop an SEM model suitable for an undergraduate thesis, master’s thesis, or journal submission,” based on your research objective and data.
Frequently Asked Questions
Q1. What types of research are suitable for Structural Equation Modeling (SEM)?
SEM is suitable for studies that want to examine multiple relationships simultaneously or test hypothesis models that include latent variables. It is used with psychological scales, attitude scales, satisfaction, behavioral intentions, organizational factors, educational effects, nursing research, and marketing surveys.
Q2. Must SEM always use latent variables?
No. Path analysis consisting only of observed variables may also be treated within the broader SEM framework. However, when constructs are measured by multiple scale items, defining latent variables makes it possible to account for measurement error.
Q3. What should I do if the SEM model fit is poor?
First, review the measurement model, data characteristics, scale items, missing values, outliers, sample size, and theoretical validity of the model. Modification indices may be used as a reference, but repeated changes without theoretical justification should be avoided.
Q4. Which fit indices should be examined in SEM?
Commonly, χ², CFI, TLI, RMSEA, and SRMR are reviewed together. Rather than relying on one index alone, model fit should be assessed comprehensively in light of theoretical validity, sample size, and conventions in the research field.
Q5. Can SEM be used in undergraduate or master’s theses?
Yes. However, the model should not be overly complex, and the research hypotheses, measures, sample size, and analytical procedure should be clearly defined. For first-time SEM users, it is preferable to begin with a simple measurement model and structural model.
Summary | SEM model building requires consistency among theory, measures, data, and interpretation
Structural Equation Modeling (SEM) is a powerful method for testing complex hypothesis models involving latent variables. However, the value of SEM does not lie merely in drawing a path diagram or listing fit indices. The key is to define latent and observed variables appropriately and build the measurement and structural models theoretically in accordance with the research objective.
SEM model building requires an integrated consideration of hypothesis specification based on prior research, scale construction, confirmatory factor analysis, evaluation of fit indices, interpretation of standardized path coefficients, examination of mediation effects, and reporting in the paper. It is important always to confirm not only whether the model fits but also whether it can be explained theoretically.
Stat Agent provides support for Structural Equation Modeling (SEM), Confirmatory Factor Analysis (CFA), path analysis, mediation analysis, multigroup analysis, scale analysis, path-diagram creation, statistical analysis, and reporting in academic papers and reports. I am unsure how to build my SEM model.、 I want to organize path diagrams and fit indices correctly.、 I want an SEM analysis suitable for an undergraduate thesis, master’s thesis, or journal submission. Please feel free to contact us in these situations.
