
Types of Statistical Software and Their DifferencesStatistical Software Comparison
Major Types of Statistical Software
This section explains types of statistical software and their differences. Statistical software is a general term for tools that support data tabulation, visualization, statistical analysis, modeling, and report preparation. Different tools are suited to different purposes and users. Some are widely used in medical statistics or academic research; others are convenient for corporate practice, strong in automation and reproducibility through programming, or suitable for large-scale data processing. In recent years, important comparison criteria includenot only “what the software can do,” but also “how reproducibly analyses can be performed,” “how easily work can be shared,” and “how well the environment can scale to future needs.”Types of Statistical Software and Their Differences
Several representative choices are available depending on purpose and analytical environment. Each is explained below.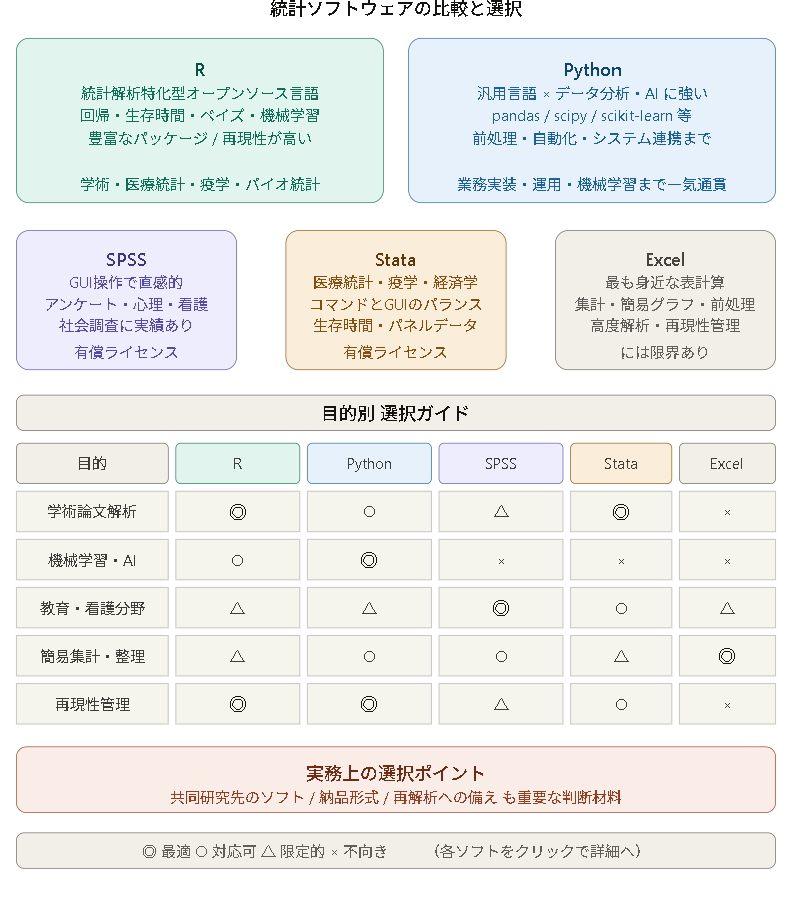
1.R:
R is an open-source programming language and statistical environment developed with a strong focus on statistical analysis. It supports a very broad range of methods, including regression, ANOVA, factor analysis, survival analysis, Bayesian statistics, machine learning, and visualization. It is widely used in academic research, medical statistics, epidemiology, and biostatistics, and its extensive package ecosystem allows flexible use of new methods. Because analyses can be code-based,it is well suited to highly reproducible statistical analysis.A potential drawback is that beginners may need some time to become comfortable with the environment.
2.Python:
Python is a general-purpose programming language that is also extremely powerful for data analysis and machine learning. Libraries such as pandas, NumPy, SciPy, statsmodels, scikit-learn, and matplotlib support statistical analysis, visualization, preprocessing, automation, and AI model development. Whereas R has a culture strongly oriented toward statistical research, Python is particularly convenient for integrating data processing, business automation, systems, and machine learning. Accordingly,Python is a strong choice when implementation and ongoing operational use are part of the goal, not analysis alone..
3.SPSS、Stata、Excel:
SPSS is statistical software with a strong graphical user interface and allows questionnaire analysis, descriptive statistics, regression, factor analysis, and other procedures to be performed relatively intuitively. It has long been used in education, psychology, nursing, and social research. Stata is strong in medical statistics, epidemiology, economics, and social sciences and offers a practical balance between command-based use and an accessible command system; it is highly regarded for regression, panel-data analysis, survival analysis, and related methods. Excel is the most familiar spreadsheet application and is highly convenient for tabulation, simple charts, descriptive statistics, and preprocessing, but it has limitations for advanced statistical analysis and rigorous reproducibility. Therefore,“ease of use” and “depth of analysis” are separate considerations, and software should be selected according to purpose.。
Choosing statistical software is not simply a matter of deciding which program is “best.” What matters is which capabilities are most important in a particular situation. R or Stata may be strong choices for rigorous academic analysis, Python for automation and machine learning, SPSS for intuitive use in education, psychology, and nursing, and Excel for simple tabulation and initial organization. Practical considerations also includewhat software collaborators use, the required delivery format, and whether future reanalysis will be needed.
R
R is especially well suited to research among statistical software options. It developed broadly in the context of statistical research and education, and new analytical methods are often implemented relatively quickly through packages. In addition to descriptive statistics and hypothesis tests, R can support advanced analyses including multivariate methods, generalized linear models, mixed-effects models, survival analysis, meta-analysis, and time-series analysis.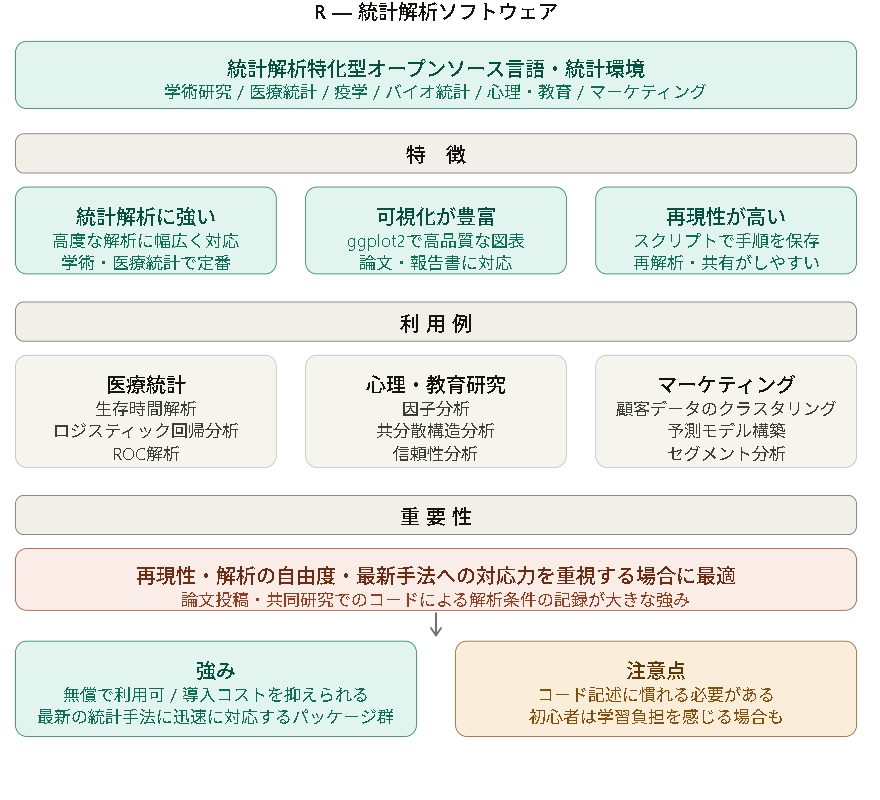
Characteristics of R
Strong statistical capabilities: Supports a wide range of advanced analyses required in academic research and medical statistics.
Rich visualization: Packages such as ggplot2 make it convenient to create high-quality figures for papers and reports.
High reproducibility: Scripts preserve analytical procedures, making reanalysis and sharing easier.
Examples of R Use
Medical statistics: Survival analysis, logistic regression, ROC analysis, and related procedures.
Psychology and education research: Factor analysis, structural equation modeling, reliability analysis, and related methods.
Marketing analysis: Customer clustering and predictive-model development.
Importance of R
R isa particularly strong statistical environment when research reproducibility, analytical flexibility, and access to newer methods are important.In journal submissions and collaborative research, the ability to retain the code and exact analytical conditions is a major advantage. R is also free to use, allowing advanced analytical environments to be built without software licensing costs. On the other hand, users need to become comfortable writing code, which can create an initial learning burden.
Thus, R is a highly capable statistical environment for researchers and practitioners who need advanced analysis.
Python
Python is generally known as a general-purpose programming language rather than dedicated statistical software, but it is a very powerful data-analysis environment. Its major strength is the ability to integrate surrounding tasks such as data preprocessing, merging multiple files, automated report generation, machine learning, natural-language processing, and dashboard development. Compared with software designed specifically for statistical research, it may have a somewhat less statistics-centered culture, but it offers strong implementation capabilities and extensibility.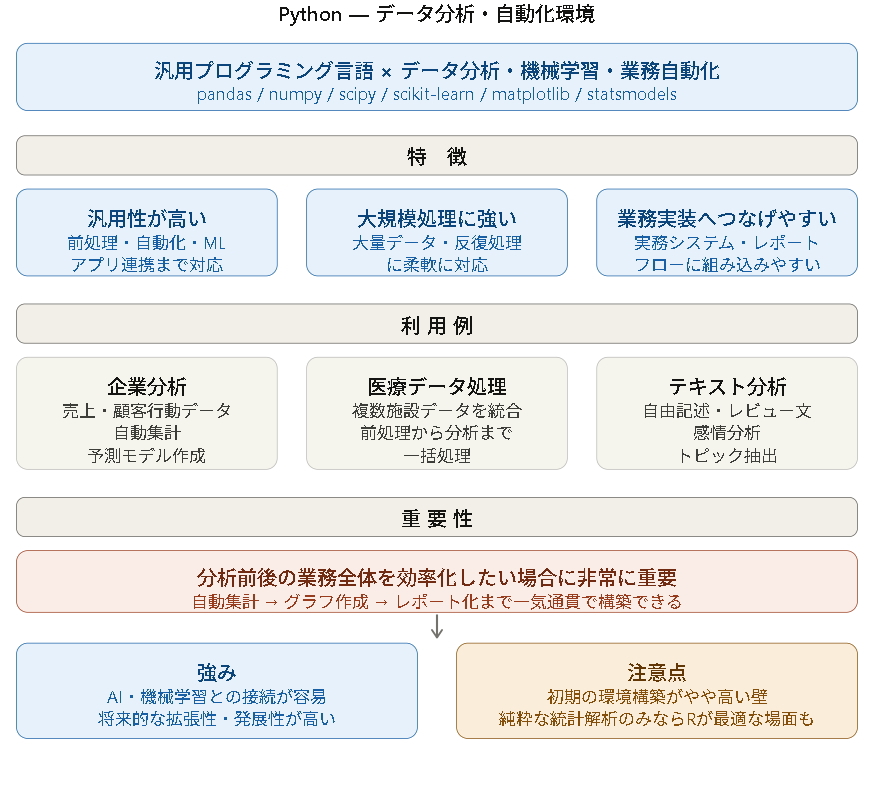
Characteristics of Python
Highly versatile: Supports not only statistical analysis, but also preprocessing, automation, machine learning, and application integration.
Strong for large-scale processing: Flexible for large datasets and highly repetitive processing.
Easy to connect to operational systems: Analytical results can be incorporated into business systems and report-generation workflows.
Examples of Python Use
Corporate analysis: Automatically aggregate sales and customer-behavior data and build predictive models.
Medical-data processing: Integrate multi-center data and carry out preprocessing and analysis in one workflow.
Text analysis: Conduct sentiment analysis and topic extraction on open-ended responses and review text.
Importance of Python
Python isespecially important when the goal is to improve efficiency across the entire workflow before and after the analysis itself.For example, Python is well suited to workflows that automatically aggregate monthly data updates, create graphs, and generate reports. Its connection with AI and machine learning also makes it a strong option when future extensibility is important. However, beginners who only want to perform conventional statistical analysis may find initial environment setup and coding relatively challenging.
Thus, Python is strong as a data-analysis environment that extends beyond statistical analysis to automation, deployment, operations, and future expansion.
SPSS、Stata、Excel
SPSS, Stata, and Excel are representative analytical tools with different roles. SPSS is largely menu-driven and relatively accessible to statistics beginners and non-programmers, and it has long been used for questionnaire tabulation and research in education, nursing, and psychology. Stata is command-based but comparatively easy to learn and is highly regarded in medical statistics, epidemiology, economics, and social research. Excel is technically spreadsheet software, but it is one of the most widely used tools in practice and is indispensable for preprocessing and simple tabulation.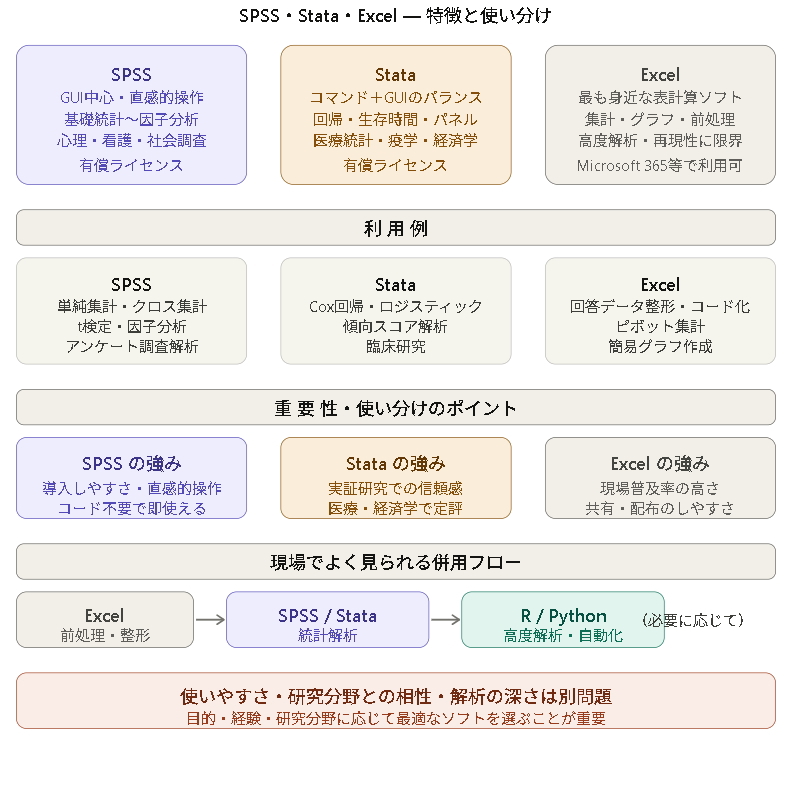
Characteristics of SPSS, Stata, and Excel
SPSS: Primarily GUI-based and relatively intuitive for procedures ranging from descriptive statistics to regression and factor analysis.
Stata: Well established in medical statistics and social science, with strengths in regression, survival analysis, and panel-data analysis.
Excel: Convenient for data entry, preprocessing, simple tabulation, and basic graphs, but limited for advanced analysis and rigorous reproducibility.
Examples of SPSS, Stata, and Excel Use
SPSS: Simple tabulation, cross-tabulation, t-tests, and factor analysis for questionnaire surveys.
Stata: Cox regression, logistic regression, propensity-score analysis, and related methods in clinical research.
Excel: Formatting response data, coding, pivot-table aggregation, and simple graph creation.
Importance of SPSS, Stata, and Excel
These tools differ inease of use, compatibility with particular research fields, and ability to support rigorous analysis.Choosing among them according to purpose is therefore important. SPSS is attractive for ease of adoption, Stata for confidence in empirical research, and Excel for its widespread use in practice. However, advanced statistical analysis may be difficult to complete entirely in Excel, while Stata or SPSS alone may be less convenient for business automation or highly flexible extensions. In practice, workflows often use Excel for preprocessing, SPSS or Stata for analysis, and R or Python when additional flexibility is needed.
Thus, SPSS, Stata, and Excel each have different strengths and should be selected according to the user's experience, purpose, and research field.
