
Tabulation and Graphing Case StudyAggregation and Graphing case
Here we present a case study ofTabulation and Graphing Case Studyour support involvingsupport case in which paper questionnaire results were digitized, tabulated, and graphed in Excel
Stat Agent does more than simply enter data. We provide integrated support includingdigitization of paper questionnaires, data cleaning, simple tabulation, cross-tabulation, graph creation, and layout adjustment for readability.
Please note thatto protect privacy, portions of the title and text have been adjusted, and published images have also been processed.Thank you for your understanding.
Case Study: Digitization, Tabulation, and Graphing of Paper Questionnaire Results
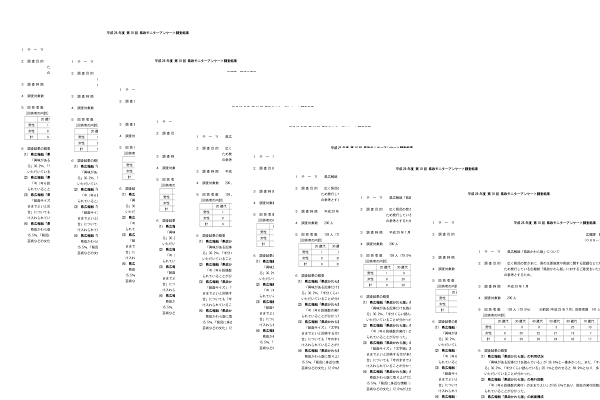
Step 1 | Reviewing the Paper Questionnaire and Aligning on the Intended Final Output
First, we review the client's paper questionnaire, number of responses, number of questions, items to be tabulated, and final delivery format.
In this case,Because the request involved “tabulation and graphing including digitization of paper questionnaire results,”we received copies of the completed questionnaires and organized them into a format suitable for data entry and tabulation in Excel.
For paper questionnaires, it is important to decide in advance how to interpret responses, handle unanswered items, process multiple responses, and enter open-ended responses.
Therefore, before beginning work, Stat Agent confirmswhich items should be tabulated, whether simple tabulation is sufficient, whether cross-tabulation and graphing are required, and whether the client needs an editable format after delivery.
Even without highly detailed specifications, we can propose an easy-to-read and practical structure for tables and graphs based on the survey purpose and question content.
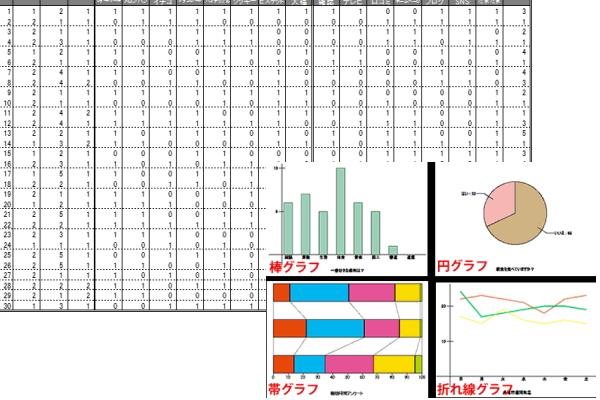 Step 2 | Digitizing the Data and Entering It into Excel
After reviewing the paper questionnaires, we enter the responses into Excel or a similar format and prepare them as electronic data.
Digitization involves more than entering text and numbers. It also requiresstandardizing response codes,、organizing missing and invalid responses,、defining data-entry rules for multiple-response items, and、formatting the data so it can be analyzed later.
As a general rule, we digitize data in Excel format, but the delivery format can be changed according to your needs, including CSV, tables for Word, and figures or tables for PowerPoint.
In this case, the work followed the steps below.
1. Review paper-based data
2. Enter and digitize data in Excel
3. Organize unanswered, invalid, and multiple responses
4. Format data for tabulation
5. Review tabulation results
6. Create graphs and adjust layouts
7. Client final review
CarefulBy integrating the process from digitizing paper questionnaires through tabulation and graphing,we prepare deliverables that are easy to use in research reports, internal corporate reports, government surveys, marketing research, and similar applications.
Step 3 | Simple Tabulation, Cross-Tabulation, and Graphing
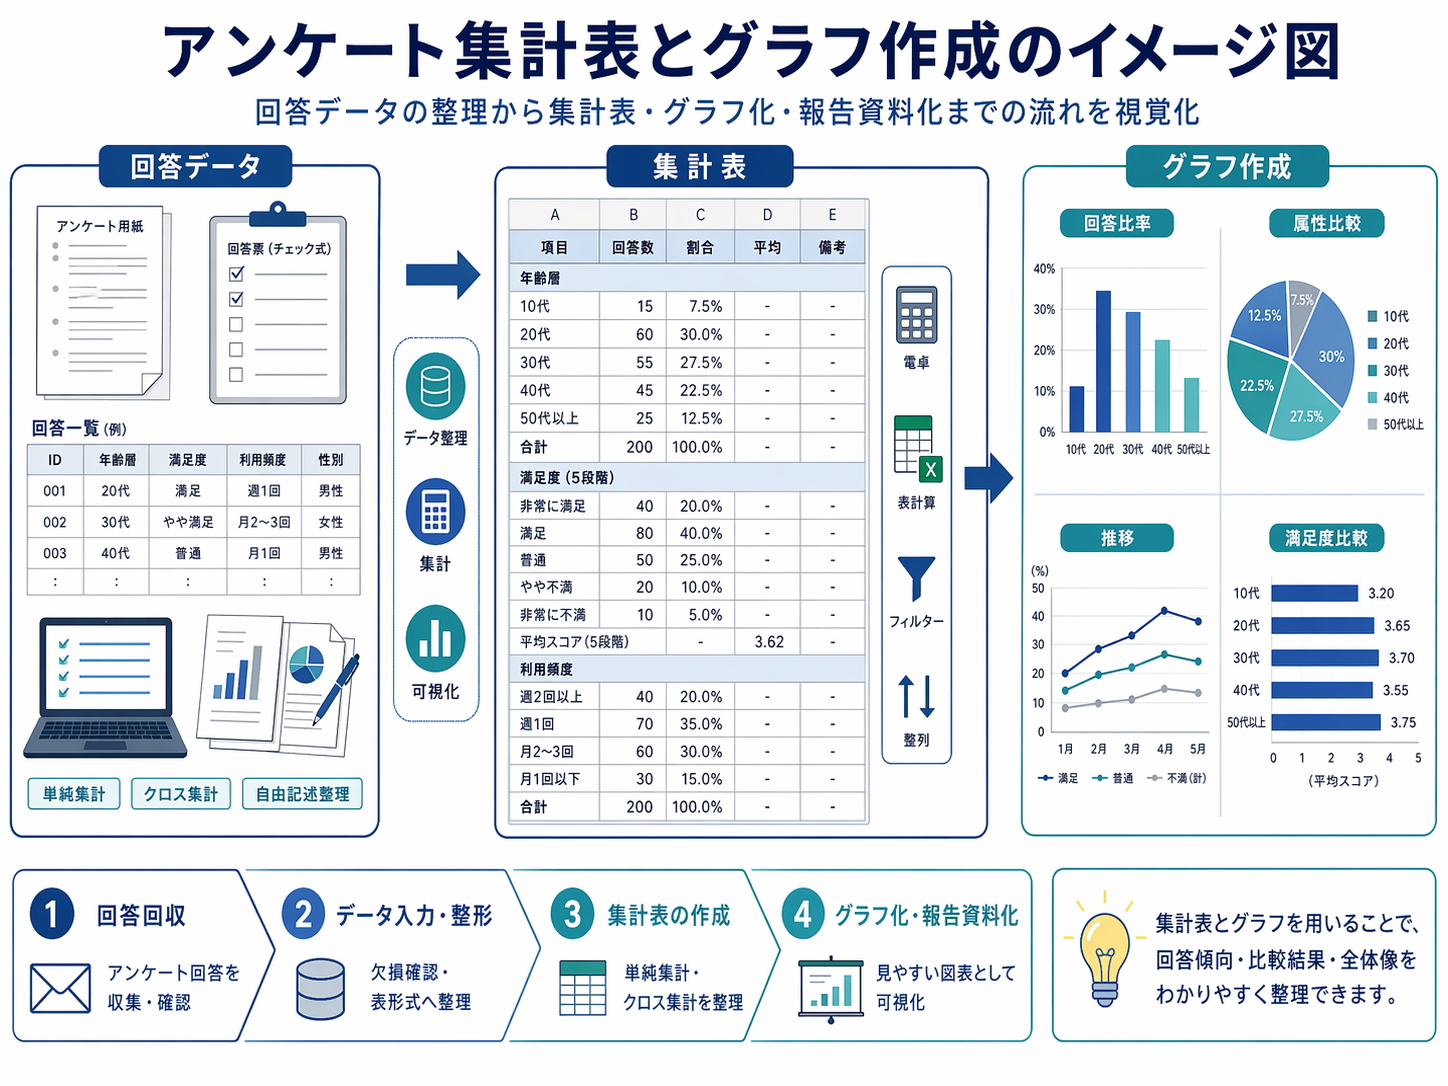
Using the digitized data, we perform simple tabulation for each question, cross-tabulation where required, and graph creation.
In addition to accurately calculating response counts and percentages, we adjust table headings, percentage displays, decimal formatting, and graph types so that readers can understand the results easily.
For example, single-response items may be shown with bar or pie charts, multiple-response items with horizontal bar charts, and comparisons by respondent attributes with cross-tabulation tables or stacked charts. We recommend formats suited to the characteristics of the data.
Stat Agent accepts a wide range of consultations regardingWhile human reviewers check consistency between the response data and tabulation results, AI may also be used as a supplementary tool to review the readability of expressions, explanations accompanying graphs, and clarity as report materials,helping createaccurate and easy-to-understand tabulation materials.
For interpretation of paper responses, question intent, treatment of invalid responses, and organization of open-ended responses—areas where AI alone may be insufficient—human reviewers proceed carefully.
Step 4 | Layout Adjustment and Final Review
At this stage, we do more than simply check for typographical errors. We confirmAfter preparing the tables and graphs, we organize the overall layout so the materials are easy to submit and share.、We check whether、table and graph values match,、percentage calculations are reasonable,
headings and legends are easy to understand, and
the format is convenient for insertion into reports and presentation materials.
Through this workflow, Stat Agent provides integrated support forWhen necessary, we also organize Excel sheets, set print areas, use color coding, add graph titles and notes, and format question wording.
As a general rule, deliverables are provided in Excel so clients can edit them after delivery. PDF, PowerPoint, tables for Word, and CSV data can also be provided on request.
Standard delivery:Delivery in 7 days
Expedited delivery:Delivery within 2 days may also be available
Digitization of paper data, preparation of summary tables, and graphing
Contact Us
Over 30,000 consultations / Over 19,000 completed engagements. To date, we have supported consultations and requests involving analysis outsourcing, statistical processing, questionnaire surveys, marketing support, and more. Our experienced consultants carefully listen to your needs so that we can provide the right support. We offer prompt and accurate work at reasonable, accessible rates and are committed to delivering dependable results. Stat Agent team members across Japan will take responsibility for supporting you.
*We provide the profile of the person responsible for your project when you apply.
For outsourced analysis and statistical processing, choose Stat Agent.
*When order volume is high, it may be difficult to reach us by phone.
We apologize for the inconvenience. We respond in order of receipt, so if your matter is urgent, please contact us by
